Lecture 10: Marketing I
Section 1: Marketing Campaigns
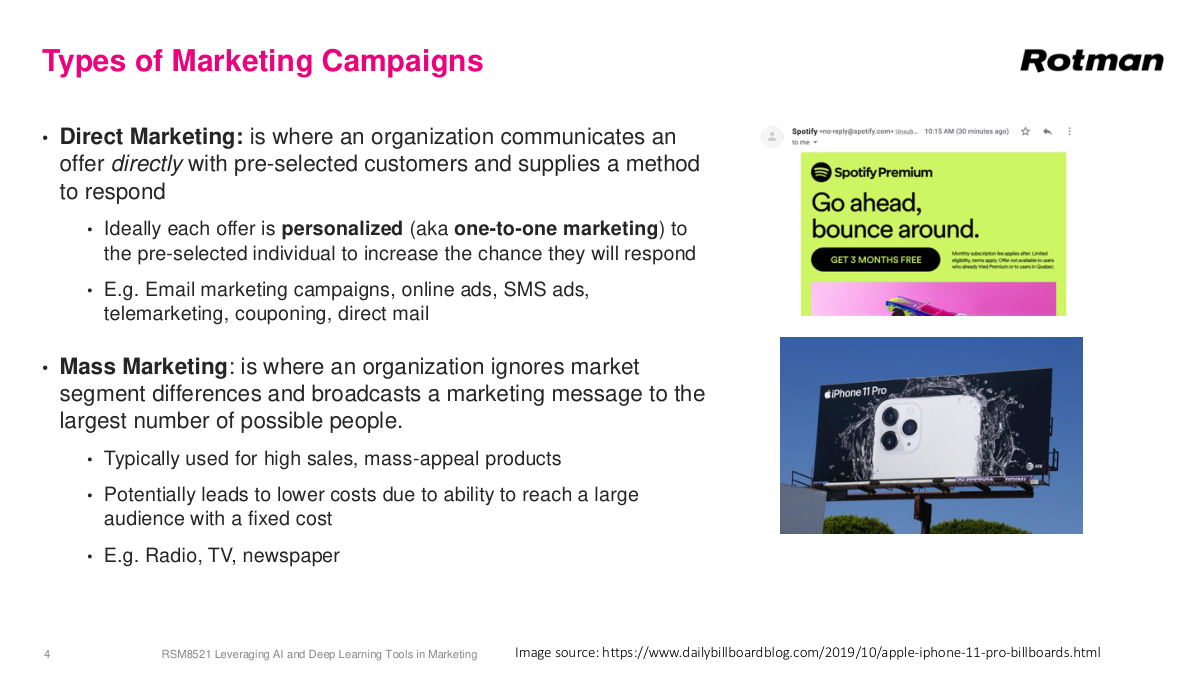
Direct marketing is where you communicate or make an offer directly to a subset of customers — even a single individual — and you can measure how they respond. Did they use the coupon? Did they click the email? This is where personalization comes in: what you see on the web or in apps is specifically tailored to you. You can do true one-to-one marketing with different content or offers for each person. Email campaigns, online ads, and mobile apps all have this flavor. Mass marketing is the opposite — you don't know who the specific person is, but you place your message somewhere prominent like a billboard or a Super Bowl ad to reach huge audiences. For a long time, with only linear TV, radio, and newspapers, this was the only way to reach people at scale. Mass marketing still works for products with universal appeal — iPhones are a great example with hundreds of millions of users. These channels remain important because of their sheer reach, but their relative importance has shrunk significantly compared to direct marketing.
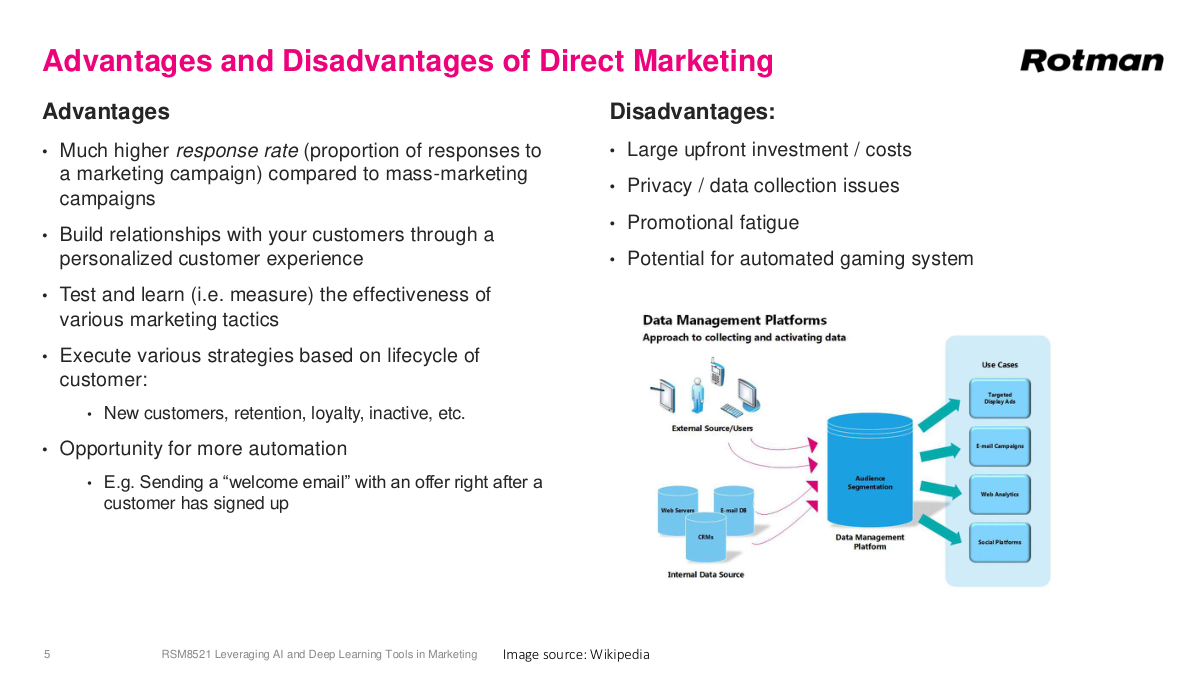
Our focus is direct marketing because this is where data gets used most effectively. The more data you have on an individual, the better you can communicate exactly what they need to see to take a desired action. Direct marketing has higher response rates because you can target specific individuals with high probability of converting. It builds better relationships since customers see more valuable content. A major advantage is test and learn — you can actually measure how well your efforts perform, which is really key. You can execute customized strategies based on where customers are in their lifecycle, and automation is essential given the ridiculous amounts of data involved. On the downside, there are large upfront costs, though that's eased by available software tools now. Privacy concerns exist but have become less of a barrier. Promotional fatigue — getting too many messages — is something you can adjust for. And then there's gaming: a friend of mine used to maintain multiple Starbucks accounts to rotate through birthday free drinks. Without sophisticated analysis, customers can exploit your campaigns.
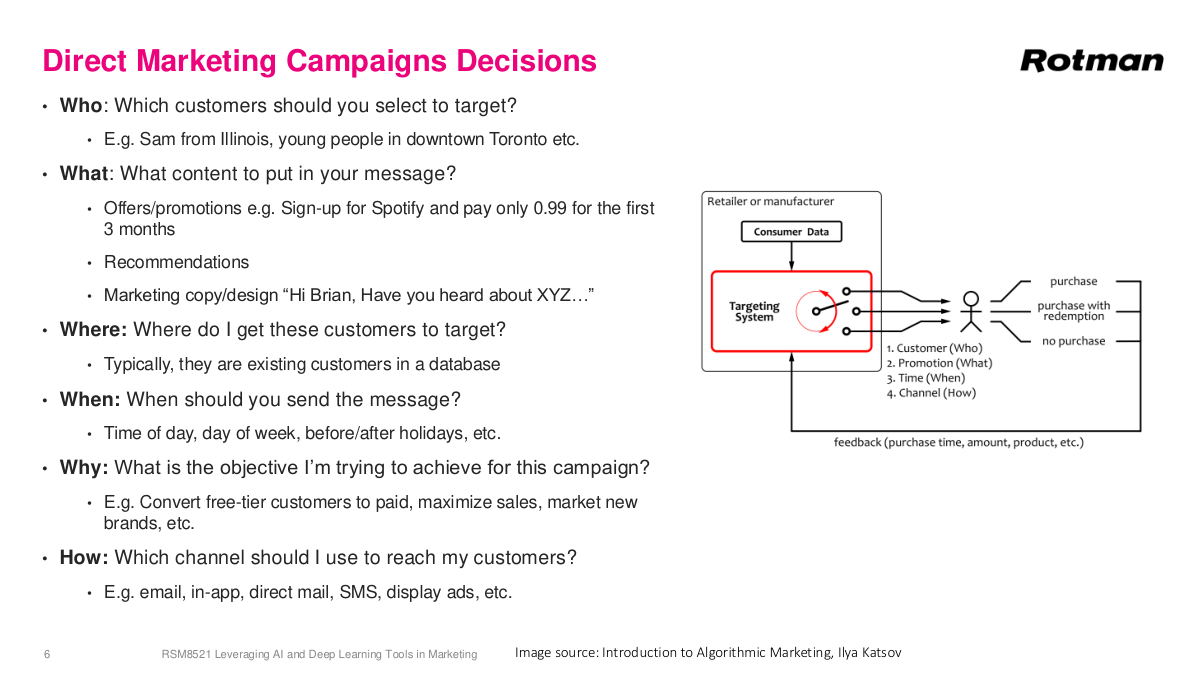
Campaign decisions come down to the six Ws, and data plays a key role in most of them. Who to target is classic machine learning — build a model to predict who's going to churn. What content to show ties into recommendation systems like Netflix or Amazon. Where to find customers usually comes from your database. When to target — Monday morning versus Tuesday afternoon — is another optimization opportunity. What objective you're optimizing for is typically conversions, sales, or engagement. And how to reach customers involves choosing among channels: email, text, in-app notifications, physical mail, or display ads. Machine learning can potentially touch all of these decisions. Advanced organizations like Instacart or Amazon constantly run and improve models because a 0.1% increase in conversion rate translates to tens or hundreds of millions of dollars. This is partly why people working on Google Search or Ads can earn a million dollars a year — if they improve ad performance by 0.1%, it generates enormous revenue. Even at smaller scale, like a retailer, these optimizations are highly relevant.
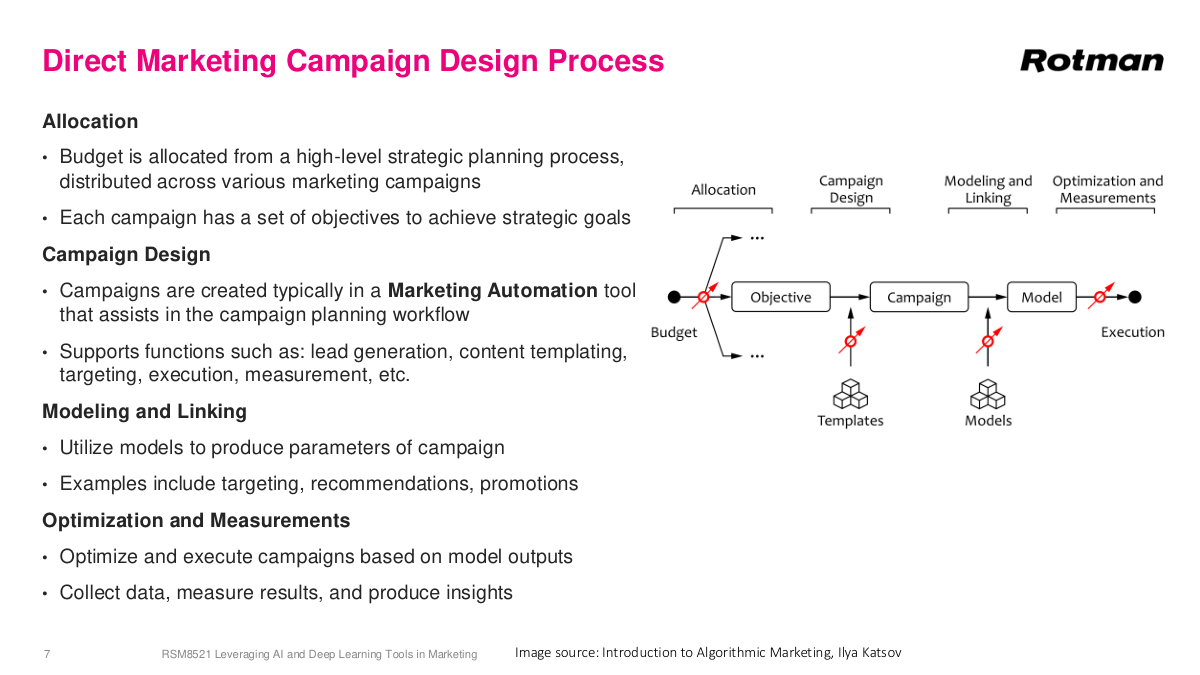
The campaign design process isn't just data science — it starts with budget allocation through strategic planning. Traditional retailers like Sephora might have a campaign calendar with Christmas, Valentine's Day, and weekly campaigns. Online businesses like Instacart run more continuously without physical constraints. The actual campaign design uses marketing automation tools like Salesforce to manage customer databases, create campaigns, and send millions of emails automatically. In the late 2000s and early 2010s, marketing automation was one of the hottest software spaces with lots of acquisitions and consolidation. You plug in machine learning scores to prioritize and target customers. Linking — drawing different databases together — is an older term but still relevant. Modeling determines who to target, and optimization handles timing and volume decisions. The most critical part is measurement. You deploy a model for your Valentine's Day campaign, measure how well it worked, learn something new, then iterate on your model or campaign for next time. This test-and-learn loop is incredibly valuable.
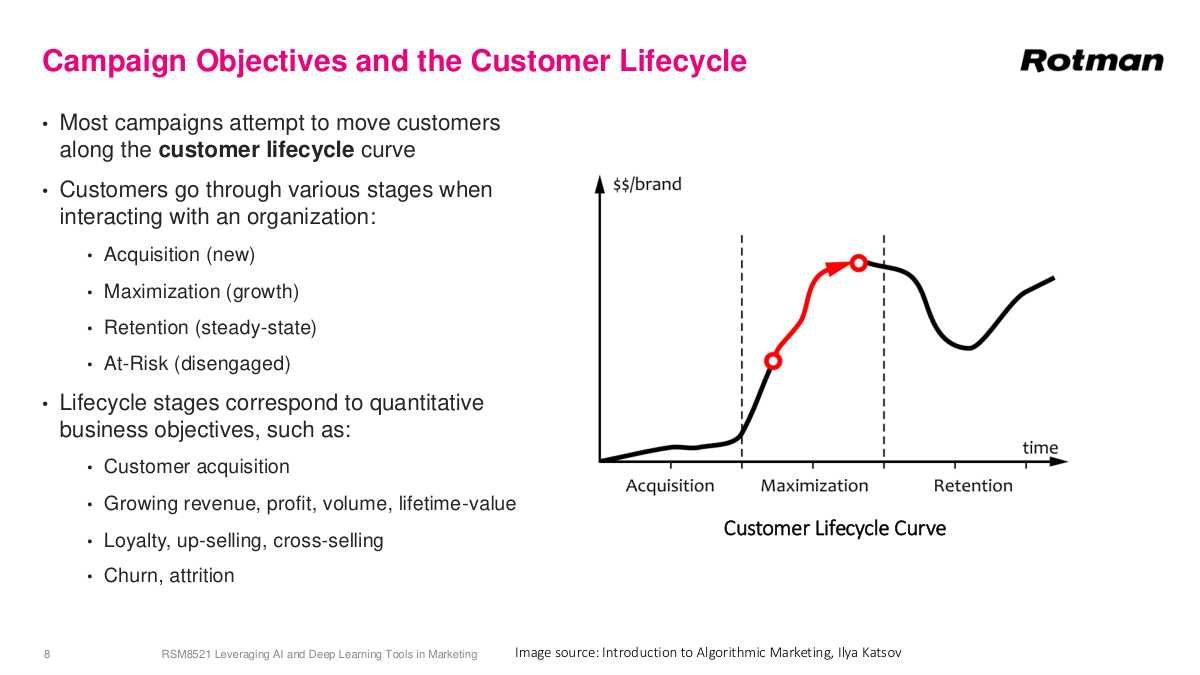
This is a generic customer lifecycle that applies across many businesses, especially SaaS. The default business model today is software as a service — monthly fees instead of one-time purchases like the old Microsoft Office model. The lifecycle has distinct phases: acquisition, which is typically the highest cost for new businesses; growth or maximization, where you increase usage — like Snowflake signing a customer at $100K and helping them scale to millions; retention, once workloads stabilize; and eventually some customers leave. This discrete view helps you segment your customer base and provide different actions based on lifecycle stage — handling churn, growing revenue, or reducing acquisition costs. Each phase maps to different objectives and campaign strategies. I want to emphasize something broader: if you're working in any space adjacent to a business, understanding how the business actually works will significantly boost your career. This isn't technically complex math or code, but it's crucial. The strongest people combine deep technical skills with solid understanding of the business side — thinking about how to reduce customer acquisition costs or finding creative technical solutions to business problems.
CRM — customer relationship management — is an older term but still widely used. It refers to any system that utilizes customer data to improve business outcomes. Salesforce is the big player in this space, but there are many more specialized systems. You'll sometimes hear terms like marketing automation systems, customer data platforms, or personalization systems used synonymously — they're all various flavors of the same general theme: using customer data to achieve business outcomes. At its core, a CRM system has a database, and that database is the valuable thing. But what really matters are the workflows around it that let you perform business functions — sending marketing emails, taking notes on customers, and so on. On top of that, you get automation of these tasks, and depending on the tool and its specialization, you might also get predictions and insights. It's a big area, and if you're working in marketing at all, you will absolutely be working with a CRM system.
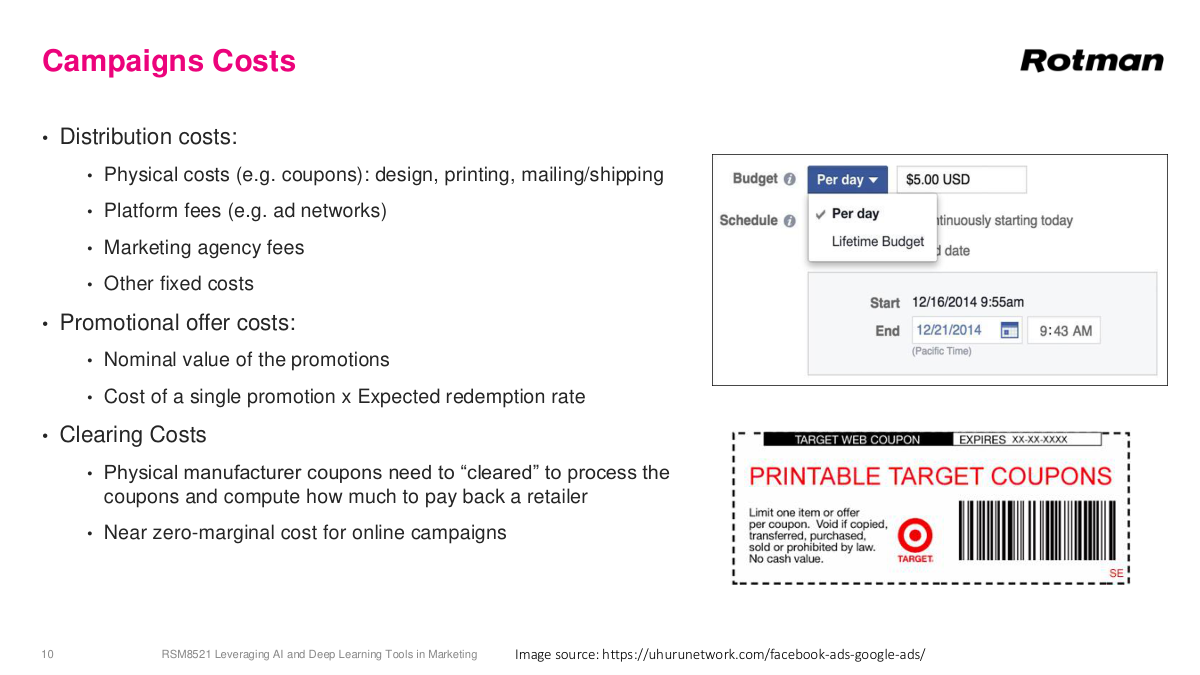
There are a few different costs you can incur with campaigns. Distribution used to be a really big one, especially before the digital age — physical costs like sending out coupons and flyers. Flyers are actually still very effective because they have a high response rate; people usually look at them. But they're expensive to send out. Then you have platform fees like ad networks, marketing agency fees, and other fixed costs. Another bucket is promotional costs. When you run an ad, you usually include a promotion — "get $10 off" or "spend $100 and save $10." That obviously reduces your gross margins, but hopefully you make it up through higher volume, more customer loyalty, or repeat purchases. Clearing costs are a bit more old school for physical coupons but can still be problematic. As a data scientist, even though you're building machine learning models and generating scores that feed into a marketing automation system, it's still relevant to understand what happens after you deliver those scores — emails go out, actions happen — and understanding the associated costs is useful.
This is a list of key performance indicators — KPIs — that you'd track in direct marketing. On the retail or consumer side, you're looking at sales, margin, response rate, average transaction frequency, average transaction value, and average order value. For online and email marketing, it's open rate, delivery rate, unsubscribe rate, and bounce rate. These are the kinds of metrics you'd watch on a dashboard because if they spike or are unusually large, you've got a problem. Conversion rate and cart abandonment rate are critical for e-commerce. For advertising specifically, cost per impression is also quite important. These KPIs collectively tell you whether your campaigns are healthy and whether you're getting the return you expect from your marketing spend.
Let's review the key concepts. Direct marketing versus mass marketing — the key difference is that direct marketing targets specific customer segments with tailored offers, while mass marketing sends the same message to a very broad audience. But the really important distinction is measurability: with direct marketing, you can measure the response. You know which specific customers you targeted and whether they converted, giving you much more data from an analytical perspective. You get a higher response rate compared to something like a Super Bowl ad, where you actually don't know how effective it was or whether it drove sales. Even mass marketing involves some implicit segmentation — Rolex advertises in high-end magazines, not everywhere — but you still can't measure who saw that ad and whether they went out and bought a Rolex. CRM is a system that leverages customer data to improve business outcomes, typically built around a database with workflows, automation, and potentially predictive capabilities on top. The customer lifecycle is simply a model of the stages a customer goes through when interacting with a business — acquisition, maximization, retention, and so on.
Section 2: Experimental Design and Marketing Campaigns
Now we move into something more interesting and also an incredibly important idea: experimental design and marketing campaigns. This is where things get really valuable from a data science perspective, because understanding how to properly measure whether your campaigns actually work is fundamental to making good marketing decisions. We'll spend some time working through these concepts carefully.
Here are the key questions for this section. What are two key questions we want to answer for campaign effectiveness? What's the difference between association and causation? What is the gold standard to measure causal effects? What other types of studies can we run to get weaker evidence of a causal effect? What is the key aspect of a randomized controlled trial, an RCT? And why can't we use an RCT for everything? These questions frame the entire discussion around experimental design in marketing — understanding when you can truly claim that a campaign caused a result versus when you're just observing a correlation.

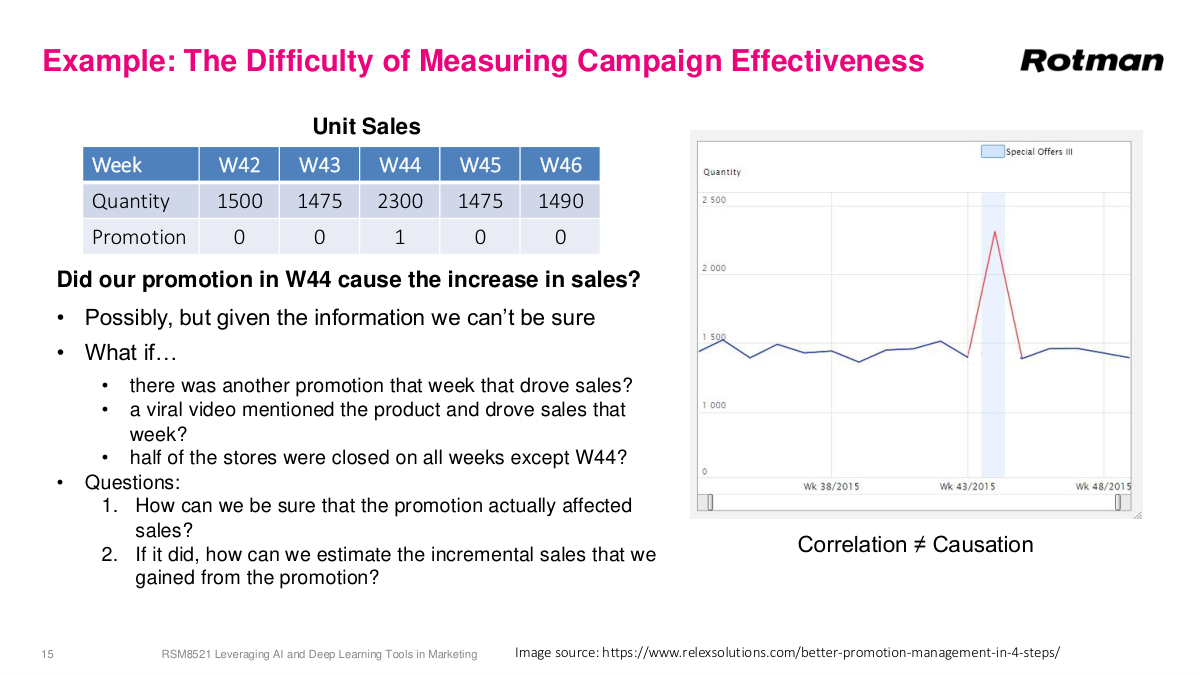
Here's a motivating example. You're looking at sales data for some business, and you ran a promotion in week 44. The graph shows an increase in unit sales that week. So the question is: did the promotion actually cause that increase in sales? It looks like it did — the sales went up right when you ran the promotion. But can you really attribute the increase just to the promotion? You don't know what else happened that week. Maybe there was another promotion running in parallel, a viral video mentioned our product, or half our stores were closed the surrounding weeks. The honest answer is: possibly, but we don't know for sure. This is exactly the problem with observational data — you can see an association but you can't definitively establish causation. The key questions are: can we be sure this promotion actually affected sales, and if it did, can we quantify how much it drove sales? Marketing and sales spending is a huge portion of most companies' budgets — often 20-30% of revenue — so answering whether our marketing dollars are being spent effectively is critically important.
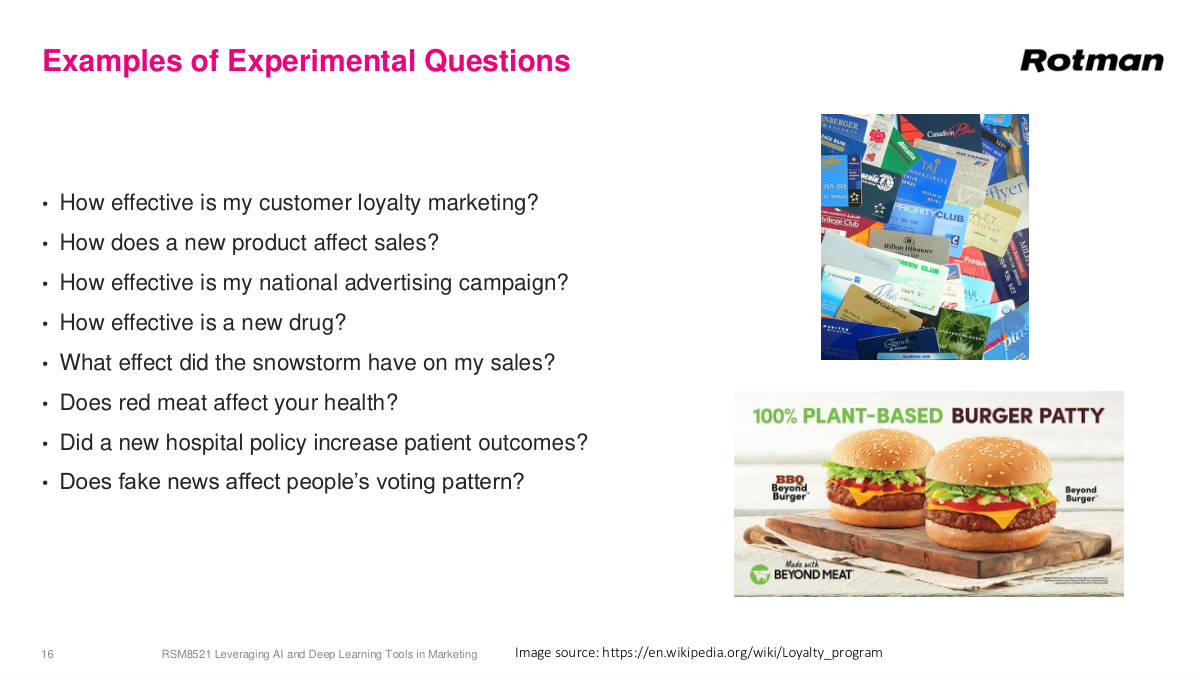
Here are examples of experimental questions that come up across many domains. How effective is my loyalty marketing — things like Aeroplan or Starbucks rewards? Does a new product affect my sales? How effective is my national advertising campaign? How effective is a new drug? What effect did a snowstorm have on my sales? Does red meat affect your health? Does a new hospital policy increase patient outcomes? Does fake news affect people's voting patterns? These are all critically important questions. The honest truth — maybe the sad fact — is that we can't get clear answers to all of them. But for some, we can. We're going to talk about how to design experiments that let us answer certain questions very confidently, and how to at least get a directional sense for the others. This all falls under the broad topic of causal inference — understanding whether one thing actually caused another.
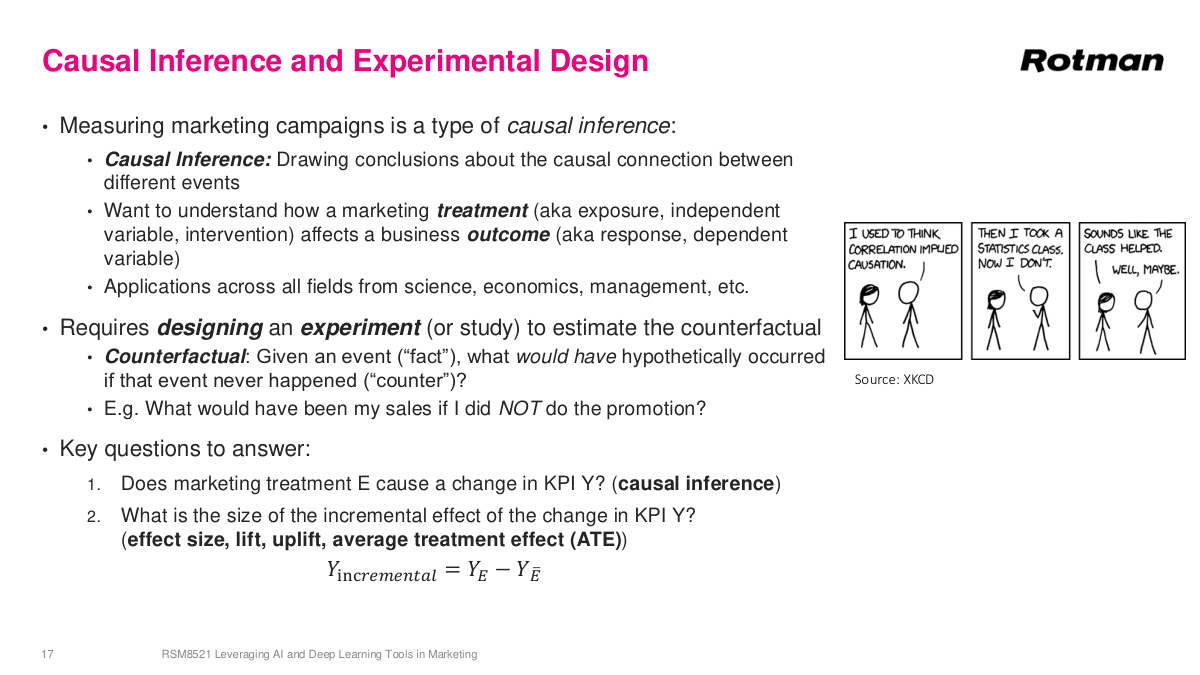
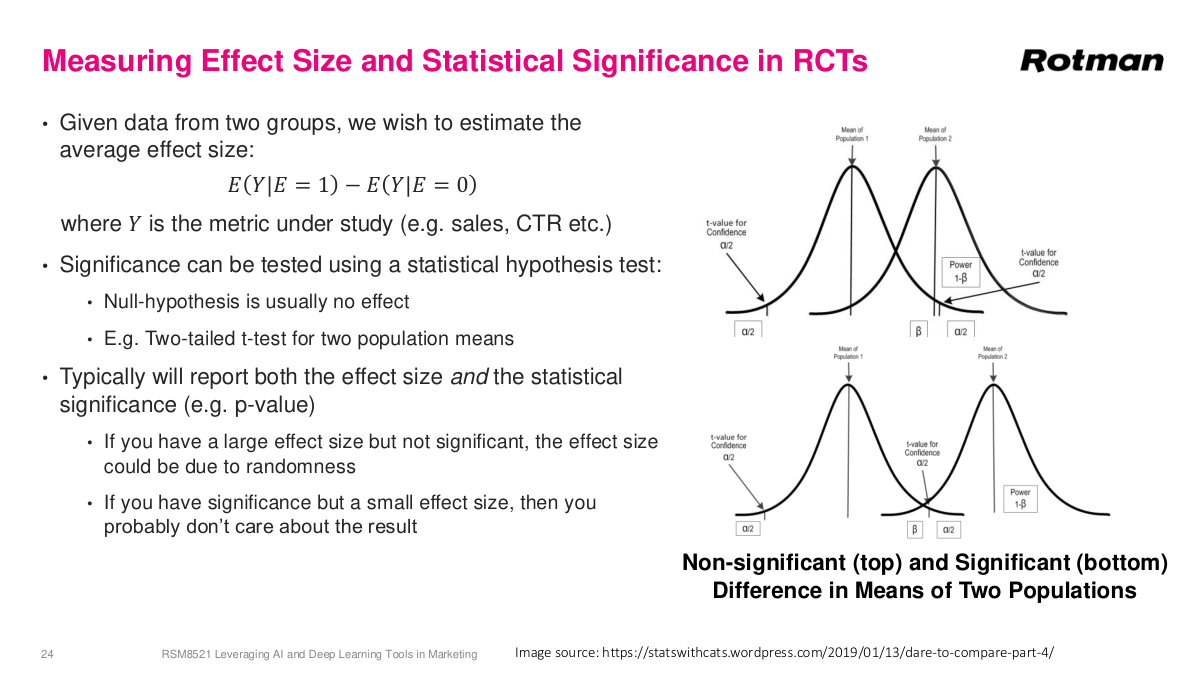
Measuring marketing campaigns is a type of causal inference — drawing conclusions about causal connections between events. Did A cause B, did B cause A, or were they unrelated? In marketing, we have a treatment (also called exposure, independent variable, or intervention) — that's our marketing campaign. And we have a business outcome (sales, engagement, response, or dependent variable). This area became especially hot in the early 2000s because databases finally got large enough to hold all customer data, enabling real analytics and predictions. Causal inference requires estimating the counterfactual — what would have happened if the event hadn't occurred. Like asking what would have happened without COVID. We can never truly know because time only runs once. This is what makes the problem so hard. In marketing, we want to answer two questions: did our treatment cause a change in our KPI, and by how much? That second quantity is called the effect size, lift, uplift, average treatment effect, or incremental effect. We want to maximize the difference between running a campaign and not running it.
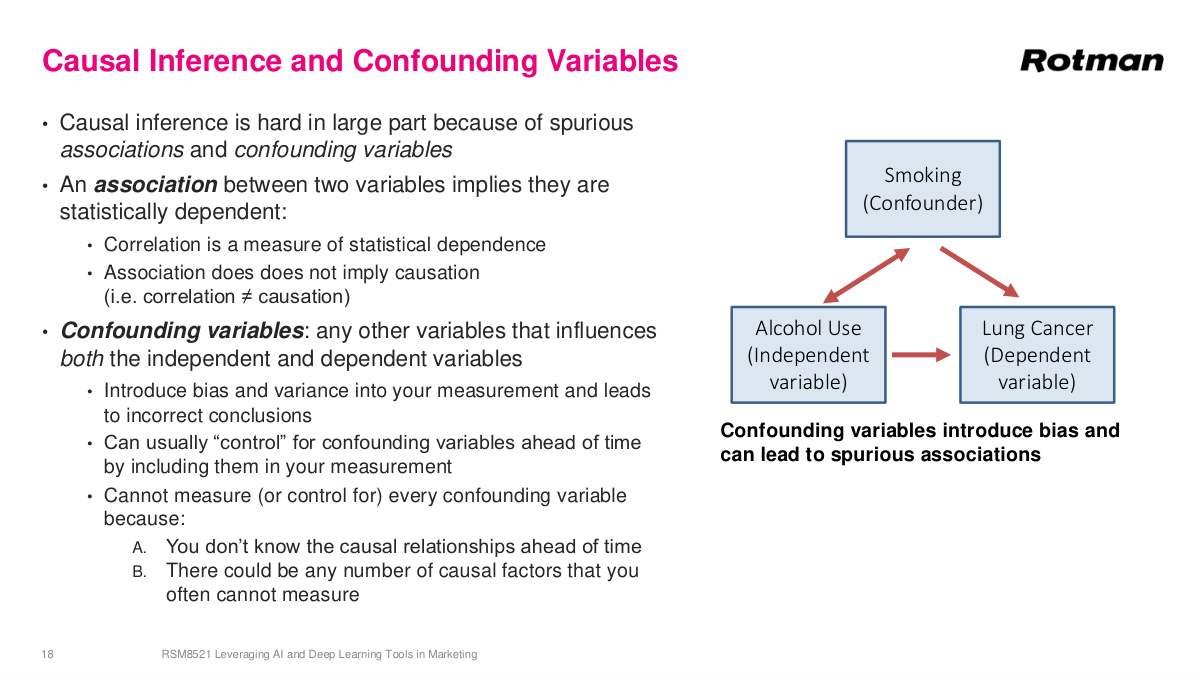
Causal inference is hard because of spurious associations and confounding variables. We can observe associations — statistical dependencies between variables — but association does not imply causation. If things are truly causal, they'll be associated, but association alone doesn't prove causation. Think of the promotion example: a viral video about our store that same week could explain the sales spike just as well. Confounding variables are variables that influence both the independent and dependent variables. Classic example: if you study alcohol use and lung cancer, you'll find a strong association. But alcohol use is also highly associated with smoking, and smoking is the actual causal driver of lung cancer. Smoking is the confounding variable here. If you don't observe it, you can't correct for it and you'll reach the wrong conclusion. If you do observe smoking, you can decouple the alcohol-lung cancer association. But practically, you can't observe every variable all the time, so there's always something you can't correct for.
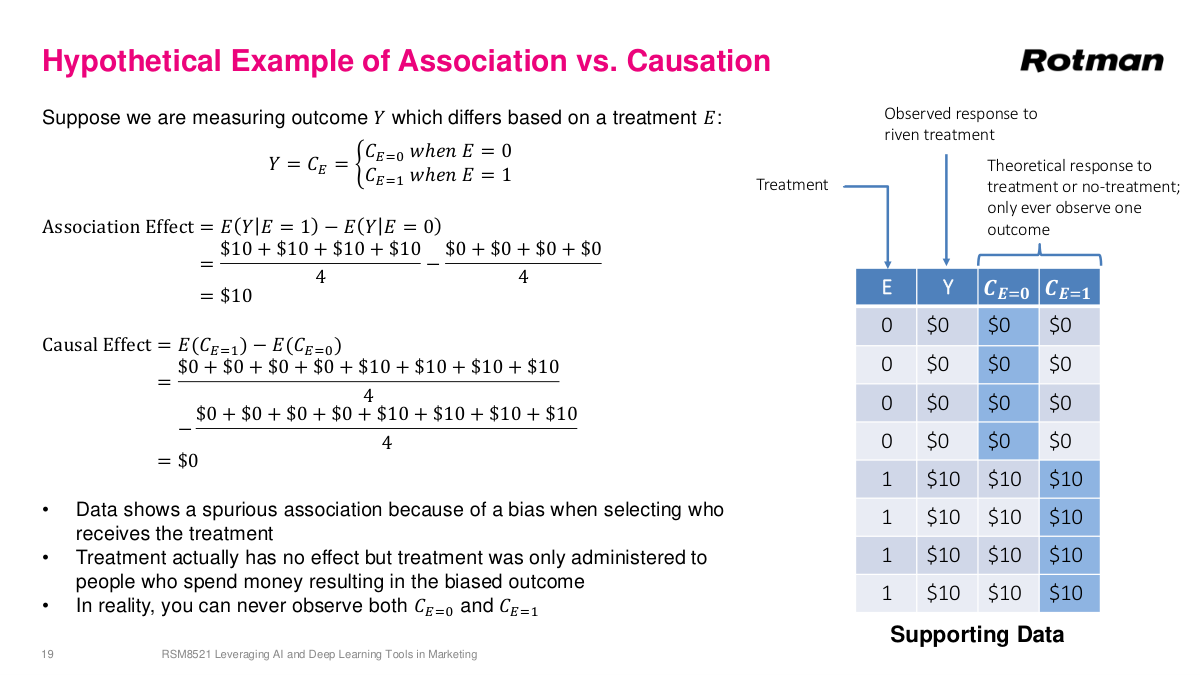
Consider a marketing example. I send emails to four people and don't send to four others. The no-email group spends $0; the email group spends $10 each. The association suggests emails drove $10 per customer. But to understand true causation, we'd need two universes — one where everyone gets the email, one where nobody does. In this hypothetical, the first four people never spend money regardless of treatment — they just don't like our store. The bottom four are loyal fans who spend $10 regardless. The actual causal effect is zero. Even though we observed a $10 association, there's zero incremental revenue from the campaign. This happens more often than you'd think — companies send promotions to their best customers who would have purchased anyway, and don't send to infrequent shoppers. The bias in who receives treatment creates a misleading association. And you can't simply run the opposite experiment next week, because time changes conditions and the two periods aren't comparable.
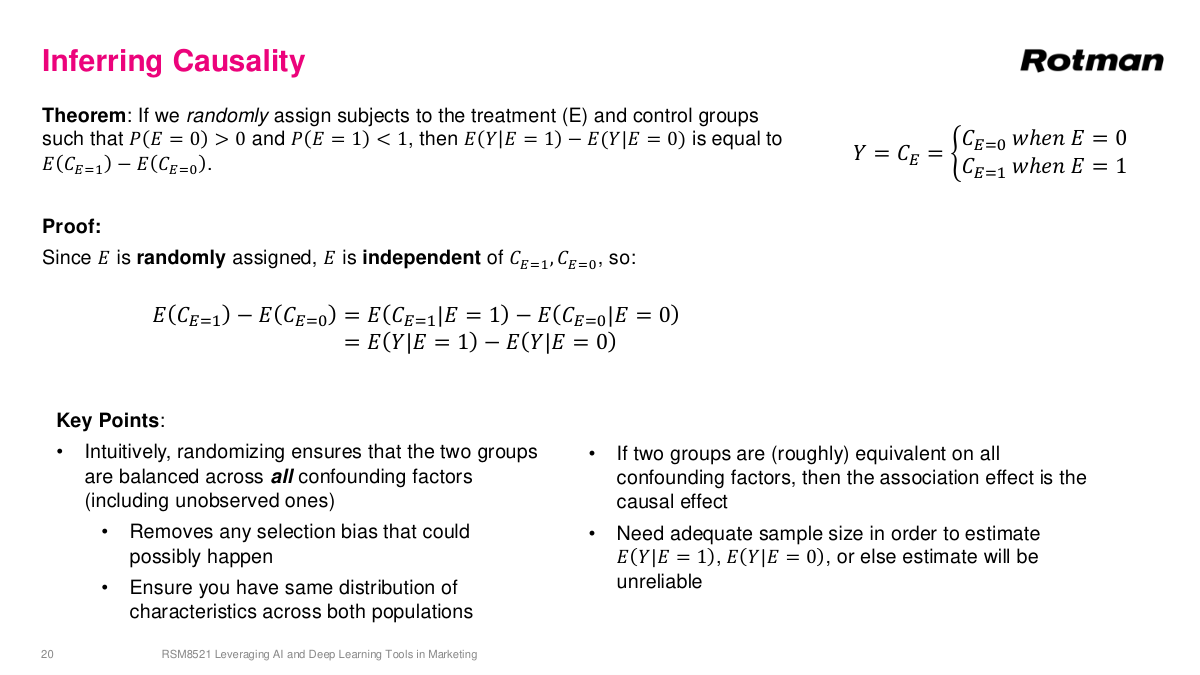
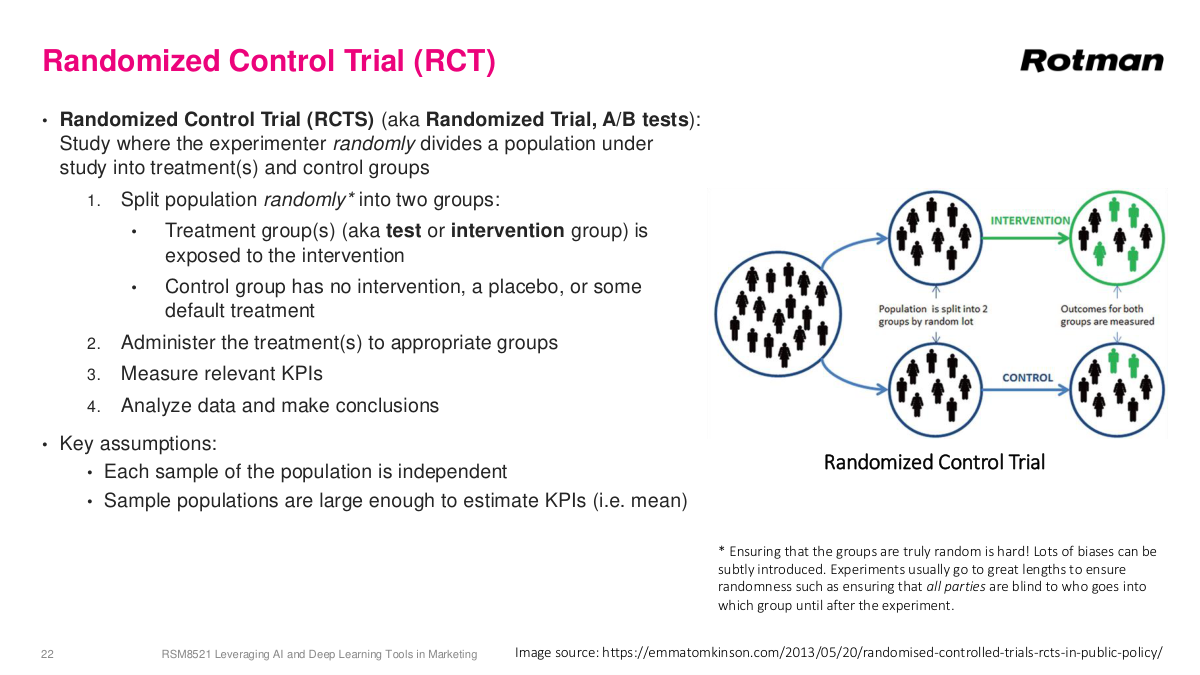
The solution is A/B testing, or randomized controlled trials. The key idea is creating two groups through random assignment. Random is the critical word here. Because treatment is randomly assigned, assuming a large enough sample size, confounding variables will be balanced across both groups. Whatever confounders exist on the A side will, on average, be equally present on the B side. This means even though we don't have an alternate universe, these two groups statistically look the same on all measures. The only difference between them is that one group received the treatment and one didn't. So when we compare outcomes — how much money each group spent — we can do so fairly. Any difference in outcomes can be attributed to the treatment itself, not to confounding variables. This is the fundamental principle behind randomized controlled trials and why random assignment is so powerful for establishing causality.
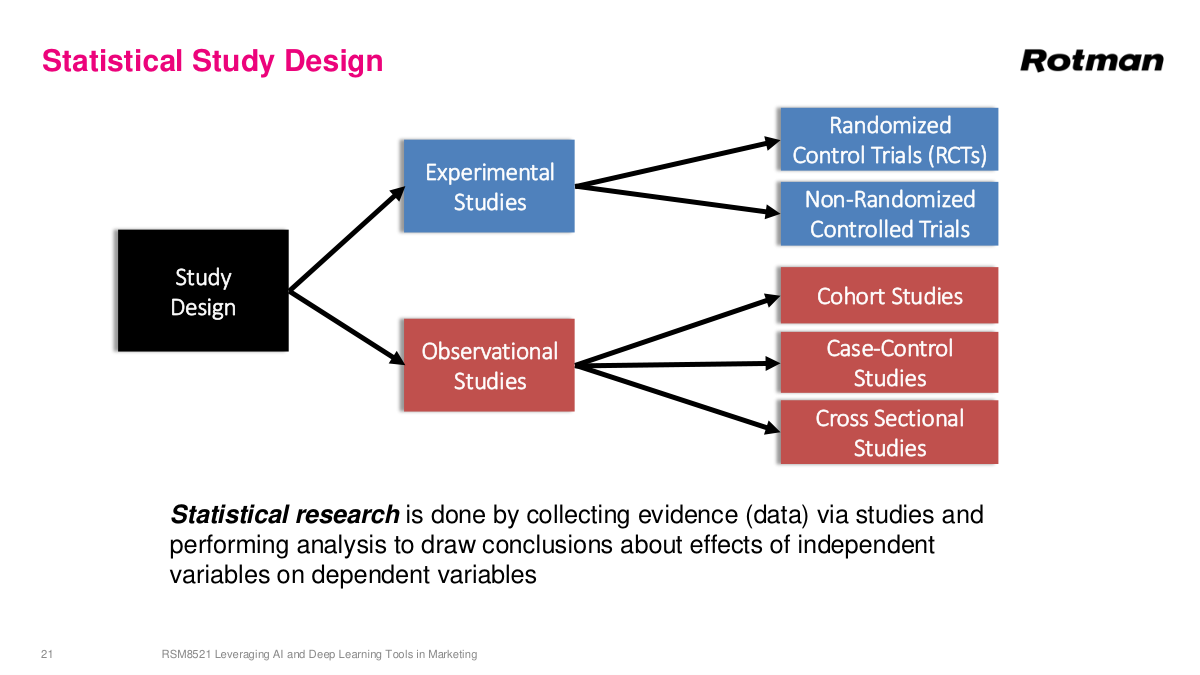
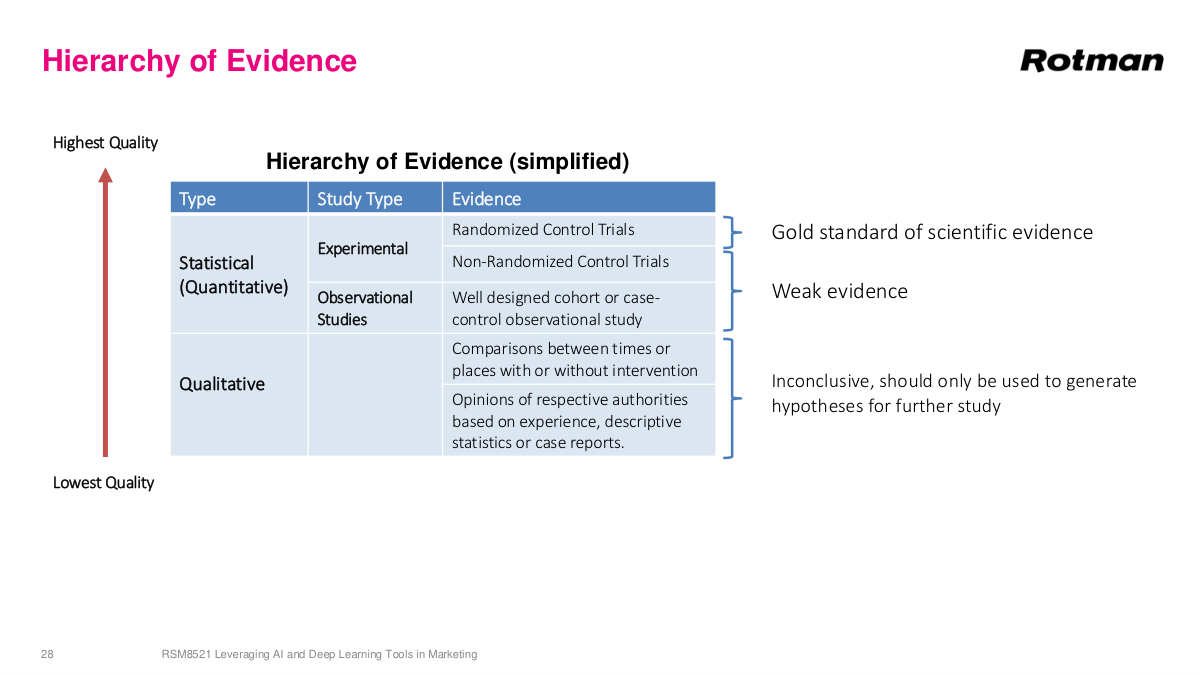
There's a hierarchy of statistical study designs. At the top are experimental studies, which can most confidently tell us whether A causes B. At the bottom are observational studies, which provide weaker evidence — things are probably true or directionally suggestive, but it's hard to conclude they're absolutely true. What's fascinating about experimental studies is that they underpin all of science. This is fundamentally how we learn about the world — through controlled experiments that help us understand how things work, both in physical sciences and in human interactions like business effectiveness. These statistical study designs are incredibly important because they represent a methodical, rigorous way for us to learn how the world actually works. We'll discuss each type to varying degrees throughout this section.
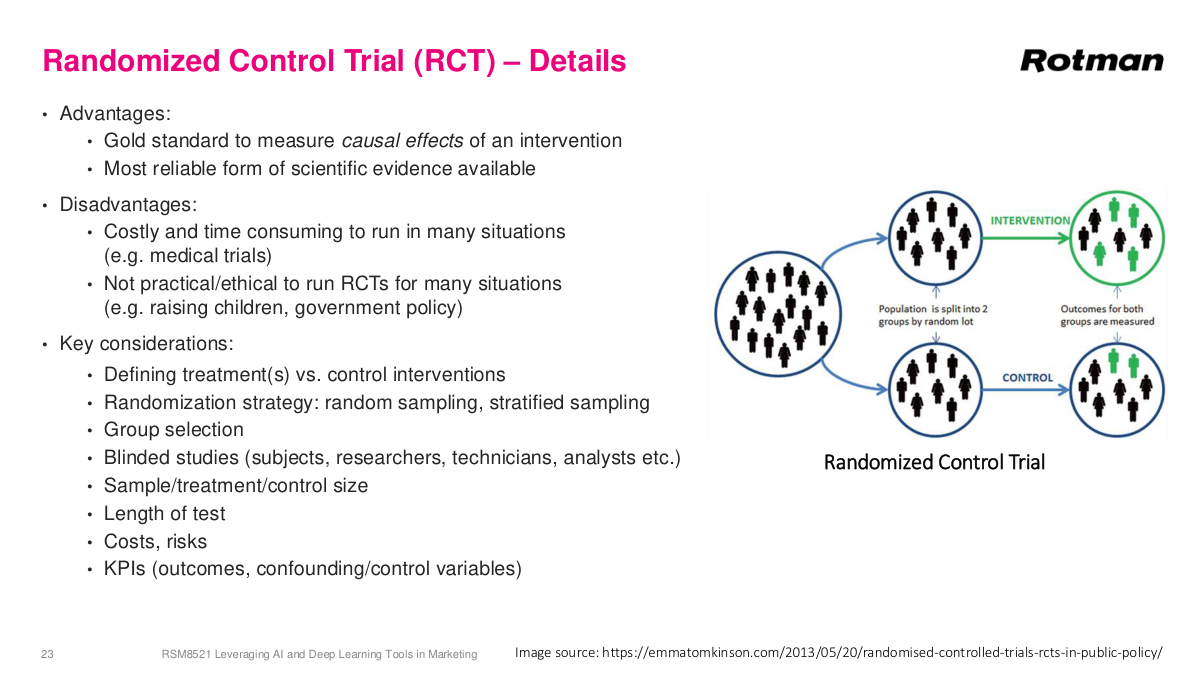
In an RCT, we randomly divide a population into treatment and control groups. The treatment group receives intervention A, while the control group gets either no treatment or the default treatment. Because the groups are randomly divided, the only systematic difference between them should be the treatment itself—so any measured difference in outcomes can be attributed to that treatment. The key assumptions are that each sample is independent and the populations are large enough to estimate averages robustly. RCTs are used everywhere. Phase one, two, and three drug trials in the U.S. are all based on RCTs. Psychological studies use them. And all A/B tests on the internet are essentially RCTs—there's a huge industry of tools built around this. It's incredibly important when making decisions to have good experimental data to determine whether the action you took is actually having the effect you think it's having. Without this rigor, you're essentially guessing.
RCTs are called the gold standard of causal inference. We don't have two parallel universes to experiment in, so this is the best method humanity has. But RCTs have real disadvantages. They're costly—think about rare cancers where you need enough patients, long follow-up periods, and must give some patients the old treatment. Sometimes RCTs just aren't practical or ethical. You can't split a country in half to test government policy, and you can't test harmful interventions on children. Proper design requires careful attention to randomization, blinding, and sample size. There's a great example from cancer history in "The Emperor of All Maladies"—an early study on radical mastectomy was deeply flawed because nurses, knowing which patients seemed sicker, would steer them into the treatment group. Without true randomization, you introduce biases that undermine the entire study. Sample size is also critical. You can use calculators based on t-tests to determine how many subjects you need. If you expect a 1% conversion increase, you might need 100,000 people per group to detect it with statistical significance.
When measuring results from an RCT, you typically run a statistical hypothesis test—null hypothesis is no effect—using something like a two-tailed t-test or binomial test, checking the p-value to ensure results aren't due to randomness. But beyond the p-value, effect size matters just as much. You might find a statistically significant result at 99% confidence that only increased conversions by 0.001%—technically significant but practically meaningless. You care about the actual impact, not just whether it's nonzero. This is especially common with large sample sizes, where it's very easy to get statistically significant results that have almost no practical value. You can absolutely see high significance with low impact, or low significance with high impact. If you're going into interviews where A/B testing matters, brush up on this. The concepts from your statistics classes are directly applicable here—model the two arms as distributions, understand the difference between them, and assess the probability of overlap. It's much more concrete than the textbook version.
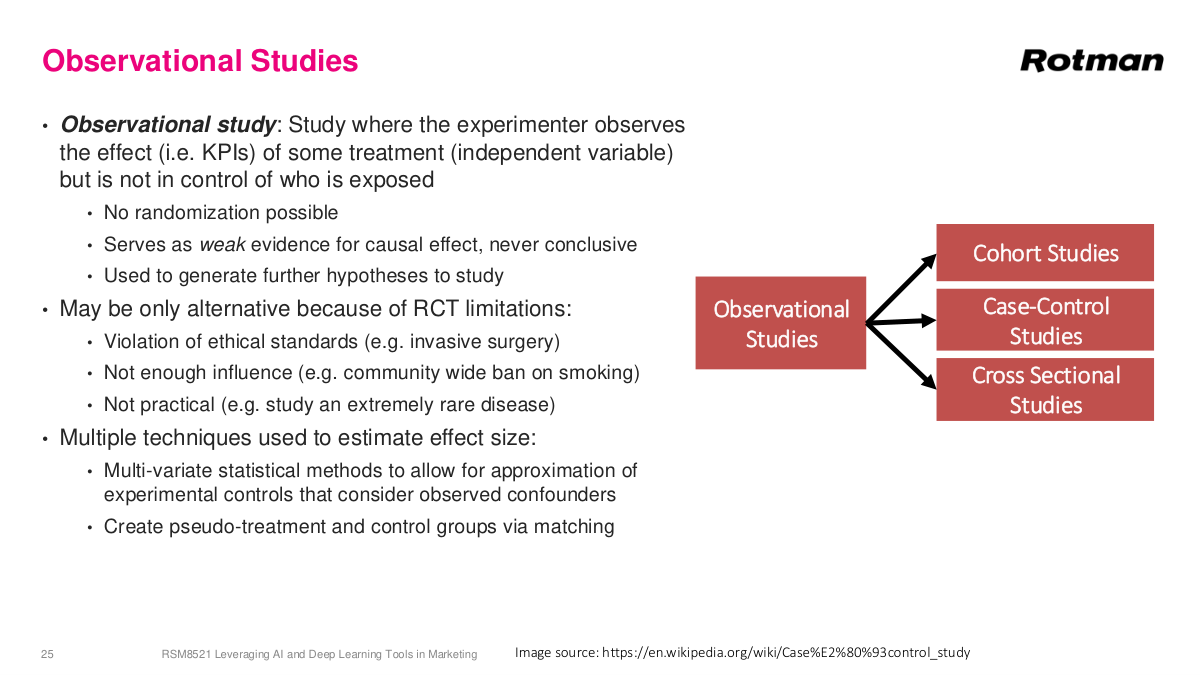
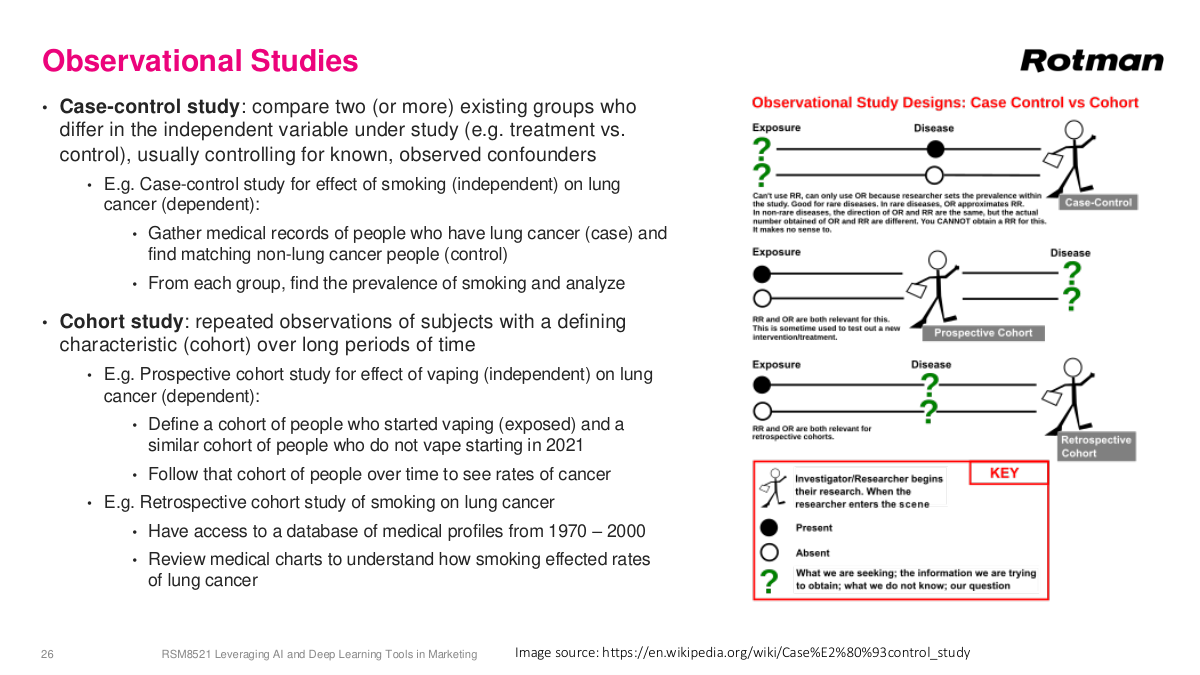
In observational studies, the researcher sees the treatment being administered but does not control who receives it. Randomization isn't possible because you can't decide who gets exposed. This means observational studies always provide weaker evidence than RCTs. Almost all nutritional studies are observational—and frankly, a lot of them are pretty garbage. Studies on red meat, alcohol, vitamins—they're typically weakly powered with low sample sizes and millions of unaccounted confounders. Things like red meat and alcohol probably are bad for you, but how bad is a much harder question to answer. Still, sometimes observational studies are all we have. Some situations involve ethical constraints—you can't trick someone into thinking they're having surgery. Some involve enforcement problems, like community-wide smoking bans or masking policies that you simply can't enforce uniformly. Some involve diseases so rare that only twenty people in the world have them. Researchers try to measure additional variables like age and occupation and correct for confounders using regression and other statistical methods, but it's never foolproof—there's always something you don't measure.
In business and data science, we use variations of medical study designs but much less rigorously — we typically skip formal statistical corrections and rely on rough gauges. A case-control study is a classic observational design: you find people who received some treatment and match them with similar people who didn't, controlling for background factors like age, occupation, and health. If the only difference is the treatment, any observed difference hints at a causal relationship. A cohort study follows a group over time — either retrospectively, mining historical data like hospital records, or prospectively, defining a cohort and tracking them forward. In SaaS businesses, cohort analysis is very common: you group customers by signup date and compare their behavior. For example, pandemic-era signups might churn at higher rates once things normalized, like what happened with Zoom. It's less rigorous than medical cohort studies, but the concept of tracking groups over time to identify behavioral patterns remains a valuable analytical tool in business contexts.
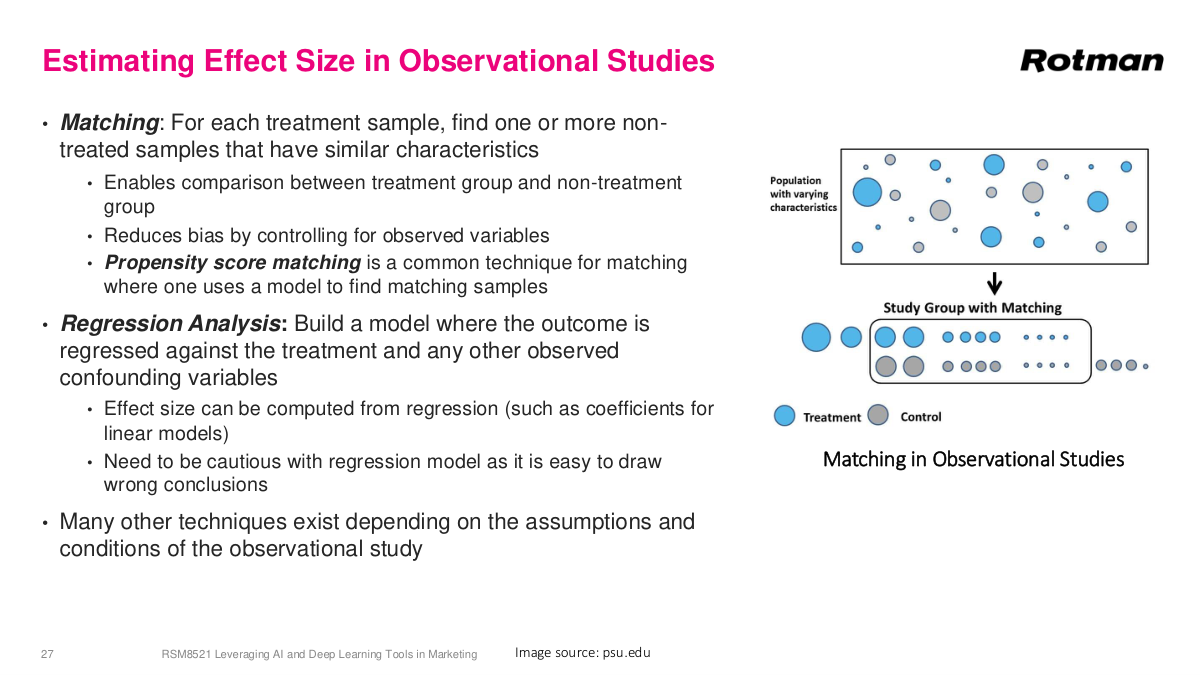
There are various methods for estimating effect sizes from observational studies, but they all come with large error bars. Matching is one key technique: for each treatment sample, find one or more non-treated samples with similar characteristics, then compare outcomes between these pseudo-treatment and pseudo-control groups. Propensity score matching builds a model to measure how similar two data points are, letting you find comparable treated and untreated individuals and compute average differences between them. Beyond matching, there are regression-based approaches where you include confounding variables — age, health status, marital status, and so on — directly in the model to control for their effects. You need to be cautious with regression models as it's easy to draw wrong conclusions. This is a huge area of statistics; you could easily take an entire master's course just on causal inference methods. Many other techniques exist depending on the assumptions and conditions of the observational study.
The hierarchy of evidence ranks different study types by the strength of conclusions they support. At the top sit systematic reviews and meta-analyses, which synthesize findings across multiple studies to provide the strongest evidence. Below that are randomized controlled trials—the gold standard for individual studies establishing causal effects. Then come quasi-experimental designs and observational studies like cohort studies, case-control studies, and cross-sectional studies, each providing progressively weaker evidence. At the bottom are expert opinions and case reports. Understanding this hierarchy is crucial for evaluating claims you encounter in practice. When someone cites a study showing some health intervention works, your first question should be: what type of study was it? A well-designed RCT provides far stronger evidence than an observational study with the same conclusion. This framework helps you calibrate how much confidence to place in any given finding and guides decisions about when additional evidence is needed before acting on a result.
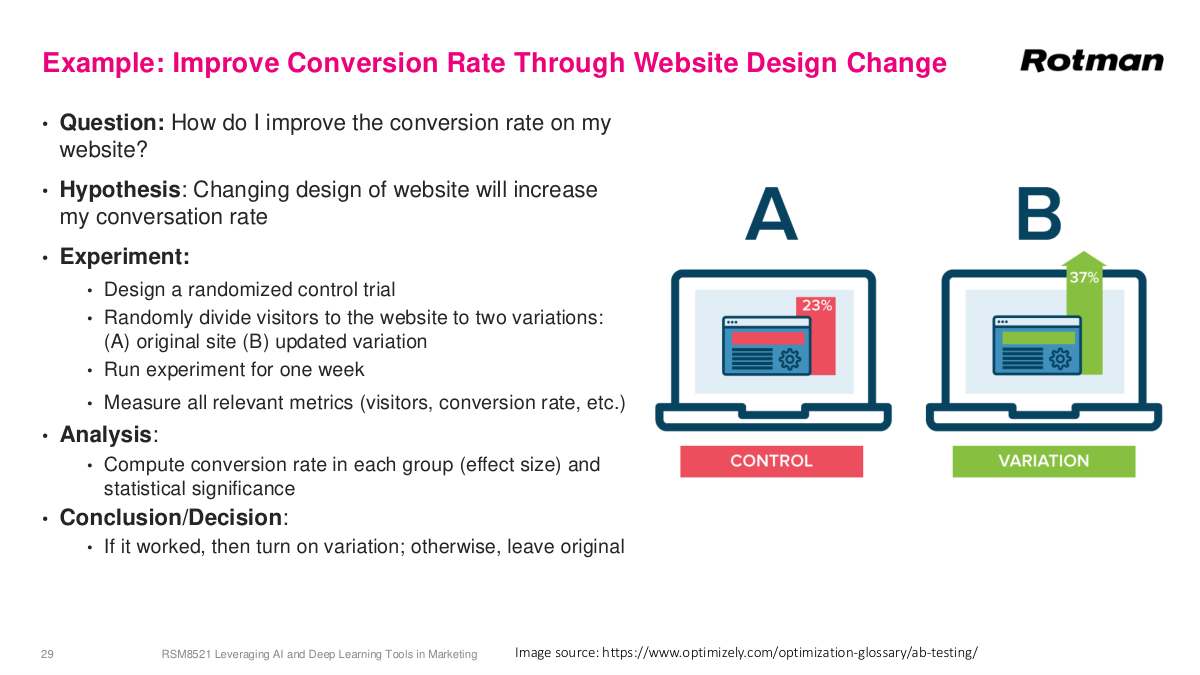
Here's a classic business example: improving website conversion rates through design changes. This was huge in the early days of the web — things like optimizing the color of your "Buy Now" button. Say you currently have a blue button and hypothesize that changing it to red will increase conversions. The right experiment is an A/B test — a randomized controlled trial. You randomly direct incoming traffic to either the original or the variation. You'd specify the duration, maybe a week depending on traffic volume, and measure all relevant metrics: conversions, visitors, and auxiliary KPIs. The analysis computes the conversion rate for each group on average and tests for statistical significance, probably using a t-test. If the variation wins, you turn it on permanently; otherwise, you keep the original. This is the most straightforward application of experimental design in business — the digital environment makes randomization easy, you can measure everything precisely, and the feedback loop is fast. It's a textbook RCT applied to a business context.
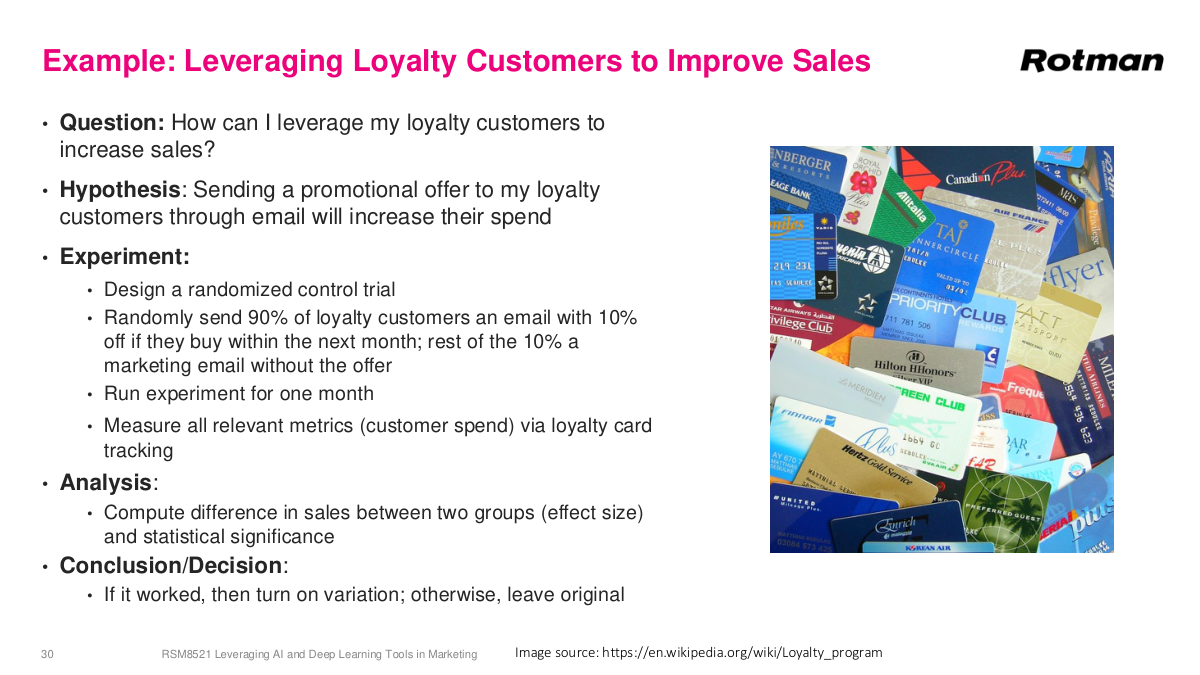
Now consider leveraging loyalty customers to increase sales. Your hypothesis: sending a promotional email offer to loyalty members will increase their spend. You run essentially an A/B test, but instead of 50-50, you use a 90-10 split — 90% get the offer, 10% don't. Why not 50-50? Because you have a strong prior that promotions generate positive ROI. You don't want to lose 40% of the benefit just for a balanced experiment. But why not 99-1? Because if the control group is too small, it won't be representative. Remember, randomization works because confounders are balanced on average — but with tiny samples, the distribution of confounding variables won't match the larger group. That's why 50-50 gives the best statistical power for a given sample size, and anything too extreme risks an unrepresentative control. A common pushback is: "I've run campaigns for 20 years, I know they work — why hold out anyone?" The answer: you need a control group not just to confirm it works, but to measure how well it works, which lets you build a proper P&L for your program.
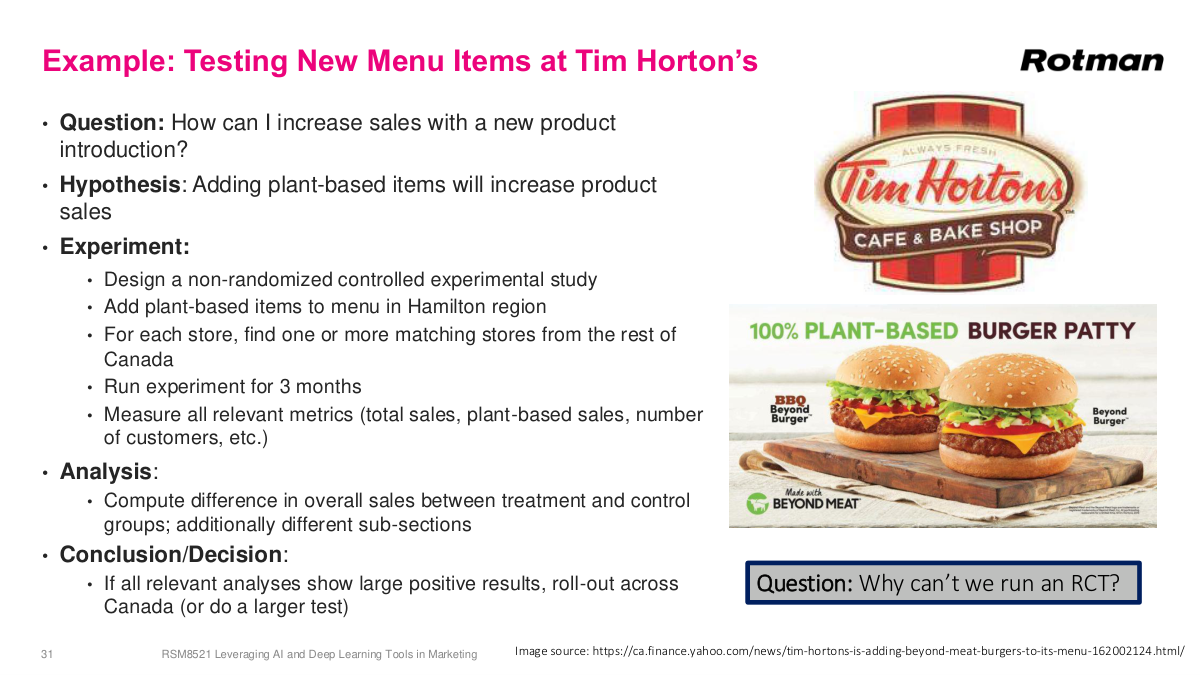
Here's another business example: Tim Horton's wants to know if adding plant-based items to their menu will increase overall sales. The hypothesis is that plant-based options drive incremental product sales. You can't easily randomize individual customers, so instead you design a non-randomized controlled experimental study — add plant-based items to menus in the Hamilton region and use comparable locations without the new items as controls. You run the experiment for three months and measure all relevant metrics: total sales, plant-based sales specifically, and number of customers. The analysis compares overall sales differences between treatment and control groups, and you can additionally break it down by different sub-sections. Because this isn't a true RCT — you can't randomize at the store level perfectly — the evidence is weaker. But the question is: why can't we just run an RCT? In retail and restaurant settings, operational constraints make true randomization very difficult. You can't randomly assign which stores get which menus without introducing logistical complications. So you do the best you can with a quasi-experimental design.
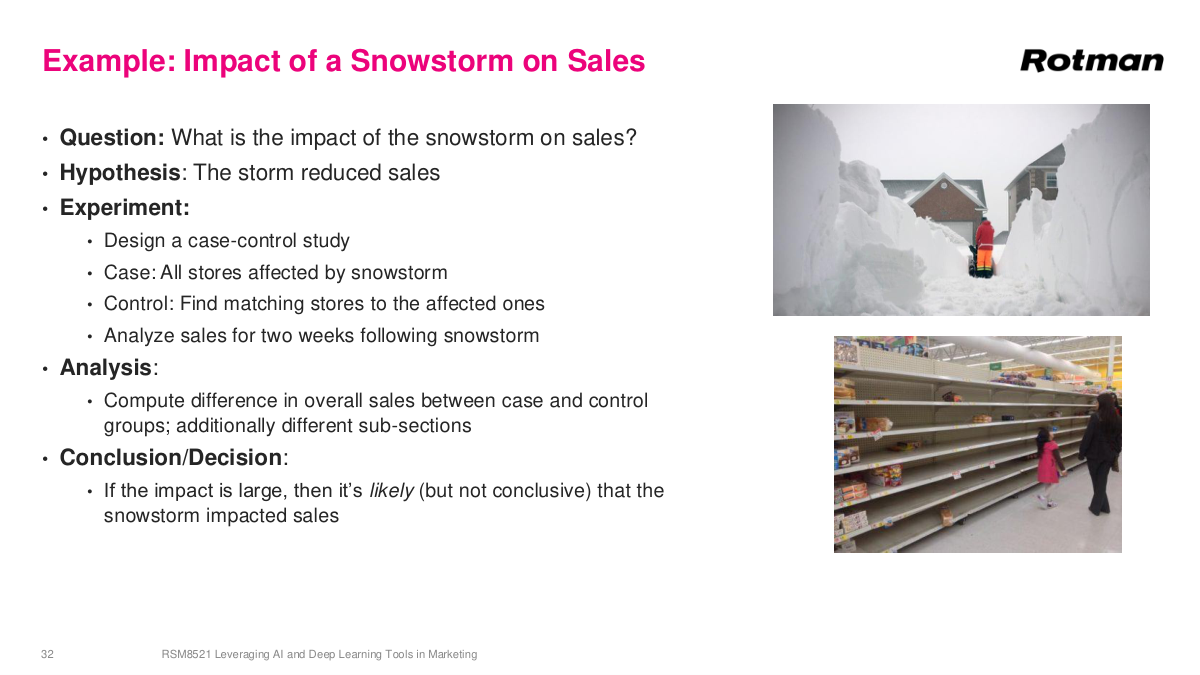
Now consider an observational study example: what's the impact of a snowstorm on your sales? The hypothesis is that the storm reduced sales. You obviously can't randomize a snowstorm — this is a natural event you simply observe. So you design a case-control study. Your case group is all stores affected by the snowstorm. Your control group is matching stores that weren't affected — you find locations with similar demographics, sales patterns, and other characteristics. You analyze sales for two weeks following the snowstorm, computing the difference in overall sales between case and control groups, and can additionally look at different sub-sections. The conclusion here is weaker: if the impact is large, it's likely — but not conclusive — that the snowstorm impacted sales. There could be other confounders you haven't accounted for. This is the fundamental trade-off with observational studies: you get some evidence, but never the same confidence as a properly randomized experiment.
Let's review the main ideas from this section. Measuring campaign effectiveness is fundamentally a causal inference problem: we want to know not just whether outcomes moved, but whether the campaign actually caused the change and by how much. Association is not enough because confounding variables can easily create misleading patterns, so the key distinction is between correlation and causation. Randomized controlled trials — A/B tests in business settings — are the gold standard because random assignment balances confounders on average and lets us estimate incremental lift cleanly. But RCTs are not always feasible or ethical, which is why observational studies, matching, regression adjustments, and other quasi-experimental approaches still matter, even though they provide weaker evidence. The practical takeaway is to choose the strongest study design your setting allows and to be explicit about both effect size and the strength of the evidence behind it.
Here are the questions we'll address in this section. What's the difference between direct marketing and mass marketing? Why do we do direct marketing campaigns, and what goals can they help us accomplish? What is meant by the customer lifecycle? And what is customer relationship management? These four questions cover the core concepts of marketing campaigns that we need to understand before getting into the more analytical and experimental design portions of this lecture.