Lecture 13: Analytics
Section 1: Analytics and Insights
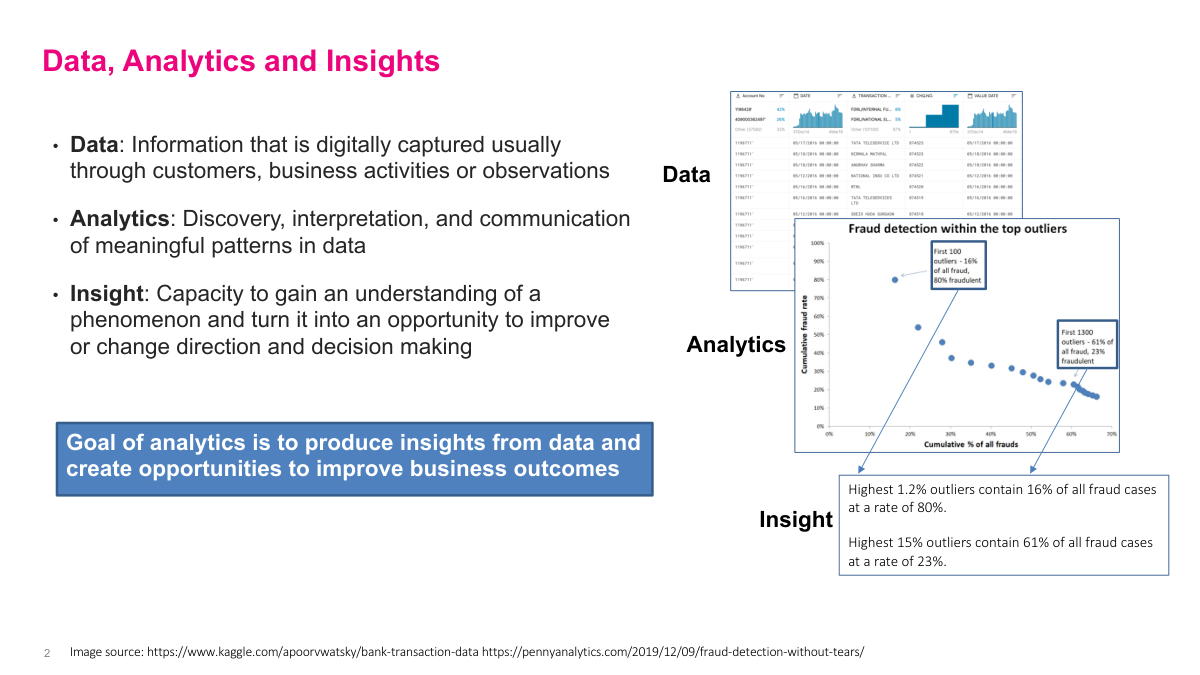
Let's define three key terms precisely. Data is information that's digitally captured through customers, business activities, or observations — think transaction tables, clickstreams, sensor readings. Analytics is the discovery, interpretation, and communication of meaningful patterns in that data. But what we really want is insight: the capacity to understand a phenomenon well enough to turn it into an opportunity for improving decisions or changing direction. The goal of analytics is to produce insights from data and create opportunities to improve business outcomes. The example here shows fraud detection — raw transaction data gets analyzed, and the insight is that the highest 1.2% of outliers contain 16% of all fraud cases at an 80% fraud rate. That's actionable. You can now focus your investigation resources on a tiny fraction of transactions and catch most of the fraud. That's the progression from data to analytics to insight in practice.
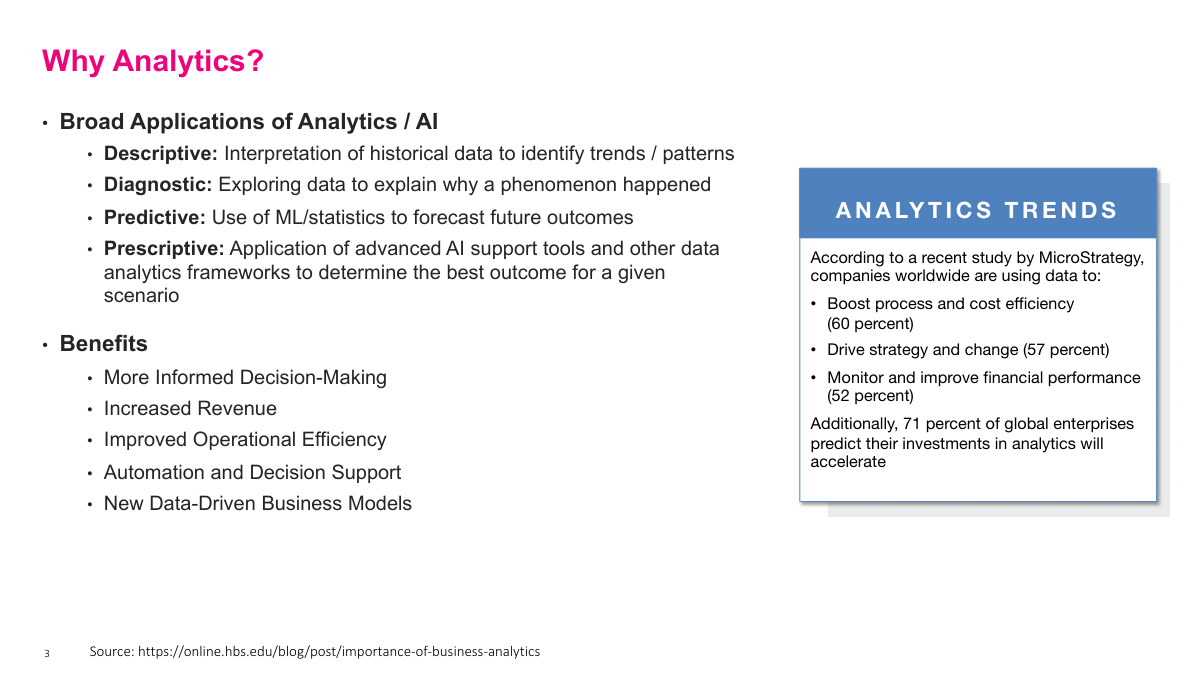
Analytics and AI have broad applications across organizations. There are four main types you should know. Descriptive analytics interprets historical data to identify trends and patterns — your basic reporting and dashboards. Diagnostic analytics goes deeper, exploring data to explain why a phenomenon happened. Predictive analytics uses ML and statistics to forecast future outcomes. And prescriptive analytics applies advanced AI and decision support tools to determine the best course of action for a given scenario. The benefits are substantial: more informed decision-making, increased revenue, improved operational efficiency, automation and decision support, and entirely new data-driven business models. According to MicroStrategy, 60% of companies use data to boost process and cost efficiency, 57% to drive strategy, and 52% to monitor financial performance. Additionally, 71% of global enterprises expect their analytics investments to accelerate. The bottom line is that analytics capabilities are becoming table stakes across industries.
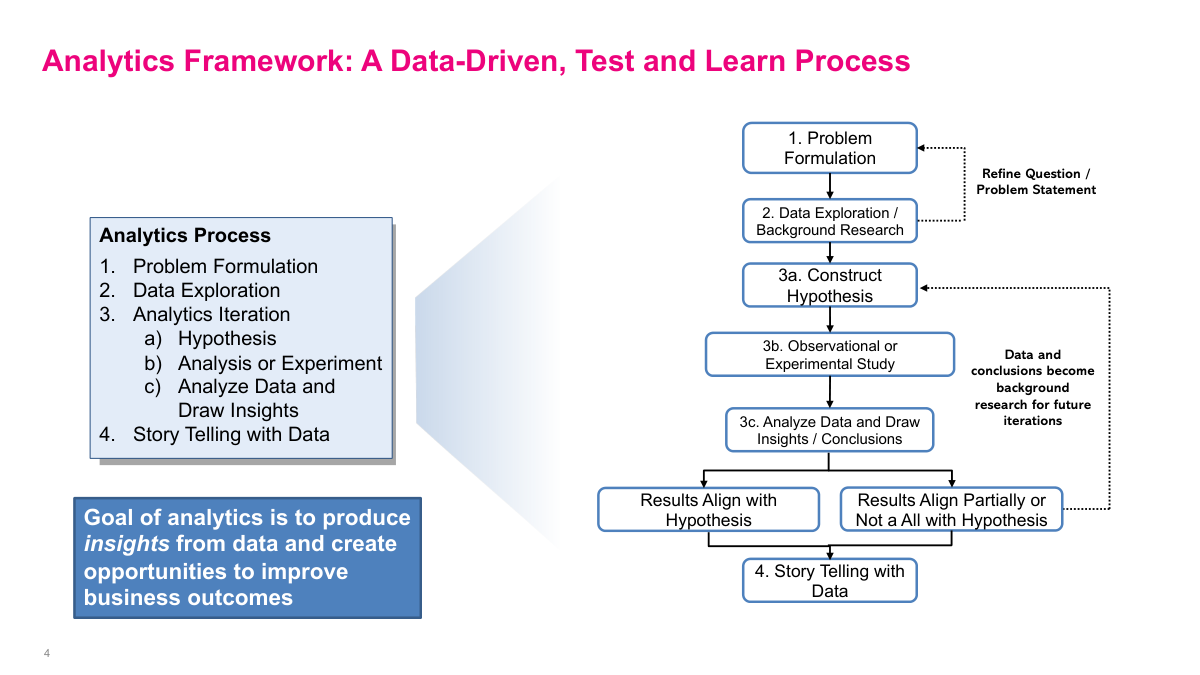
Here's the analytics framework we'll use throughout this lecture — a data-driven, test and learn process. It has four main steps. First, problem formulation: define the business question clearly. Second, data exploration and background research: understand what data you have and what it's telling you. Third, the analytics iteration cycle, which has three sub-steps — construct a hypothesis, run an observational or experimental study, then analyze the data and draw insights or conclusions. If results align with your hypothesis, great. If they partially align or don't align at all, that's still valuable because those conclusions become background research for your next iteration. You refine the question and go again. Fourth, story telling with data: communicate your findings effectively. The goal of analytics is to produce insights from data and create opportunities to improve business outcomes. This entire process is iterative — you'll cycle through hypothesis, test, and conclude multiple times before arriving at a solid, actionable recommendation.
Section 2: Problem Formulation
Now we move into the problem formulation section. This is the critical first step of the analytics framework. Getting the problem statement right determines whether the rest of your analysis will be productive or a waste of time. A well-formulated problem gives your team direction and focus, while a vague or poorly scoped problem leads to unfocused exploration that never converges on actionable insights.
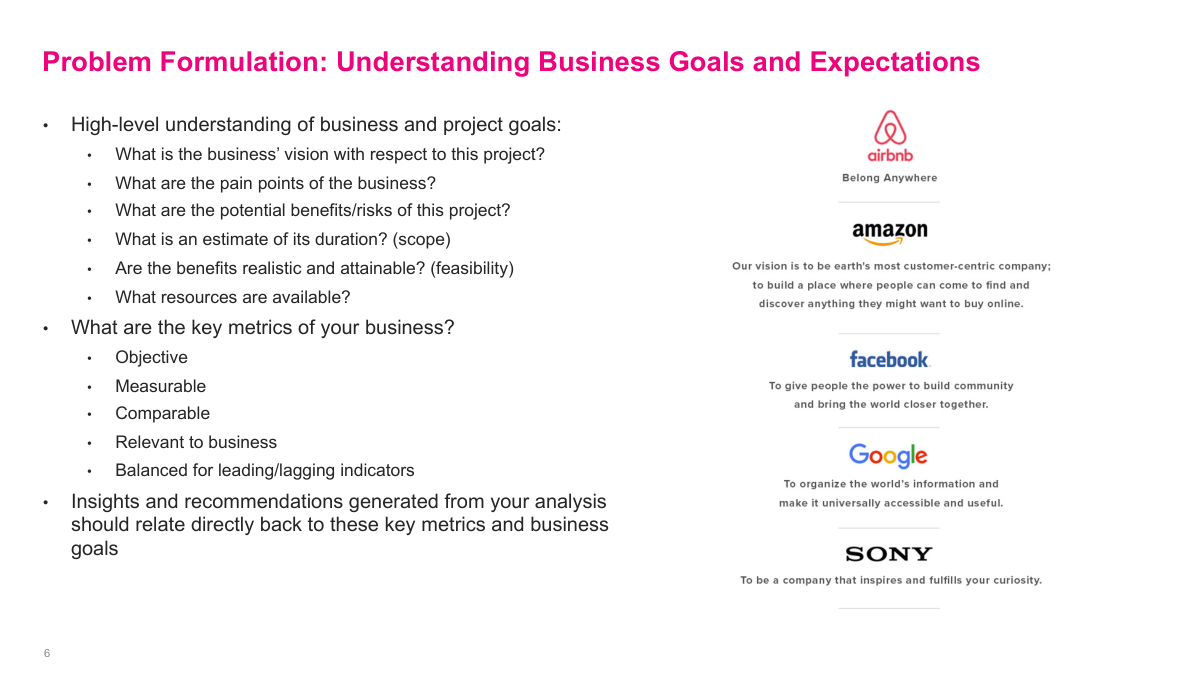
Problem formulation starts with understanding the business context at a high level. You need to ask: what is the business's vision for this project? What are the pain points? What are the potential benefits and risks? What's a realistic timeline? Are the benefits attainable? What resources are available? Then you need to identify the key metrics of the business. Good metrics are objective, measurable, comparable, relevant to the business, and balanced between leading and lagging indicators. Any insights and recommendations you generate should relate directly back to these key metrics and business goals. The slide shows mission statements from companies like Airbnb, Amazon, Facebook, Google, and Sony — these illustrate how a clear business vision provides the anchor point for all analytics work. If you don't understand what the business is trying to achieve, your analysis won't connect to anything actionable.
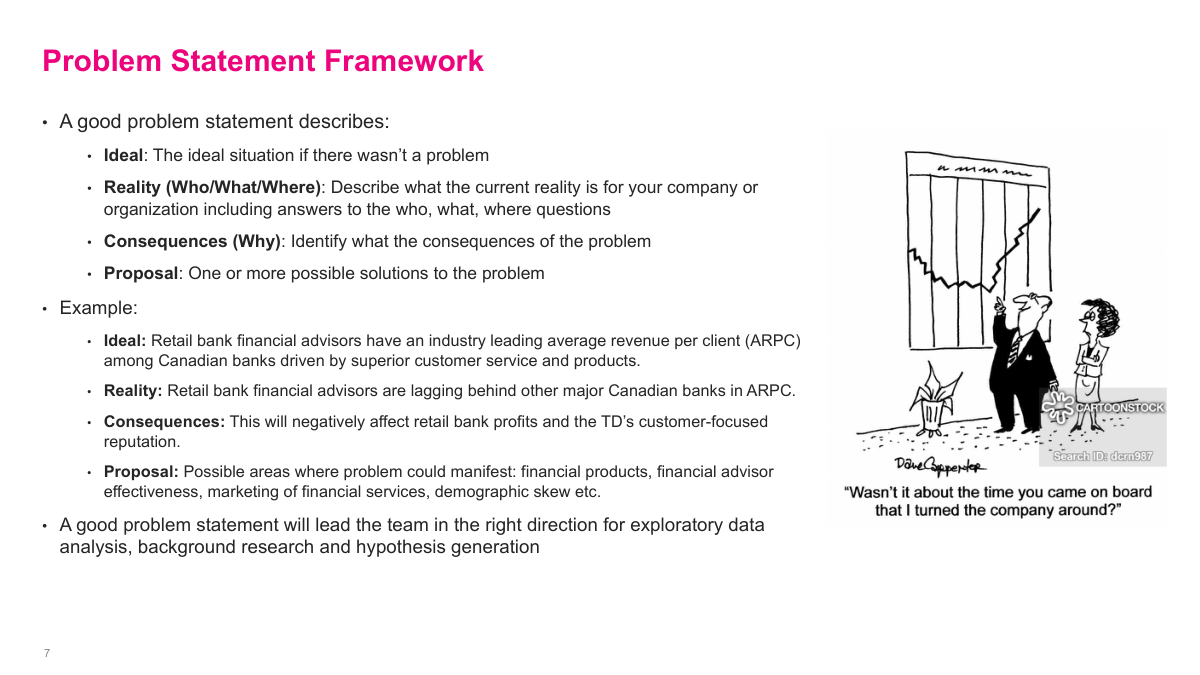
A good problem statement has four components. First, the Ideal: describe the ideal situation if there wasn't a problem. Second, the Reality — who, what, where: describe what the current reality is for your company or organization. Third, the Consequences — why: identify what the consequences of the problem are. Fourth, the Proposal: offer one or more possible solutions. Here's an example from retail banking. Ideal: retail bank financial advisors have industry-leading average revenue per client driven by superior customer service and products. Reality: they're actually lagging behind other major Canadian banks in ARPC. Consequences: this will negatively affect retail bank profits and the bank's customer-focused reputation. Proposal: possible areas to investigate include financial products, advisor effectiveness, marketing of financial services, demographic skew. A well-crafted problem statement leads the team in the right direction for exploratory data analysis, background research, and hypothesis generation.
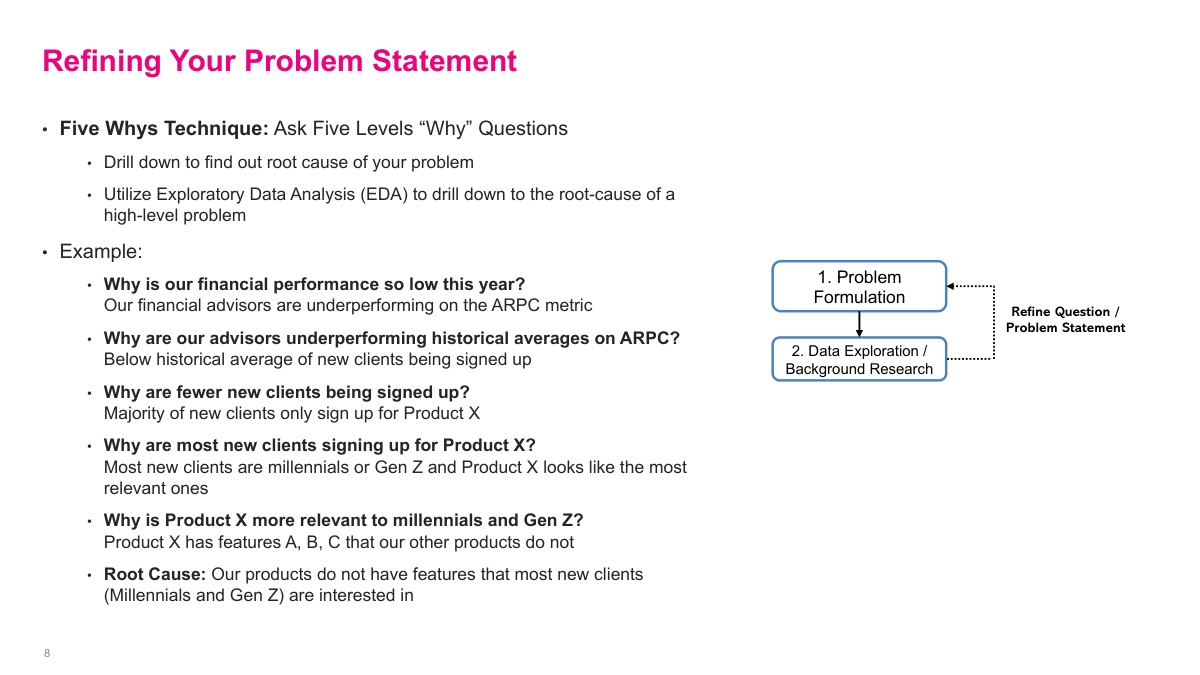
The Five Whys technique is a powerful method for refining your problem statement. The idea is to ask five levels of "why" questions to drill down from a high-level symptom to the root cause, using exploratory data analysis at each level. Here's an example. Why is our financial performance so low this year? Because our financial advisors are underperforming on average revenue per client. Why are they underperforming historical averages? Because below-average numbers of new clients are being signed up. Why are fewer new clients being signed up? Because the majority of new clients only sign up for Product X. Why are most new clients signing up for Product X? Because most new clients are millennials or Gen Z and Product X looks like the most relevant one to them. Why is Product X more relevant to millennials and Gen Z? Because Product X has features A, B, C that our other products do not. Root cause: our products do not have features that most new clients — millennials and Gen Z — are interested in. Each "why" drives you to a more specific, testable problem statement through the data exploration process.
Section 3: Data Exploration
Now we move into the data exploration section. This is step two of the analytics framework, where you take the problem statement you've formulated and start examining actual data to understand what's happening and generate hypotheses for testing.
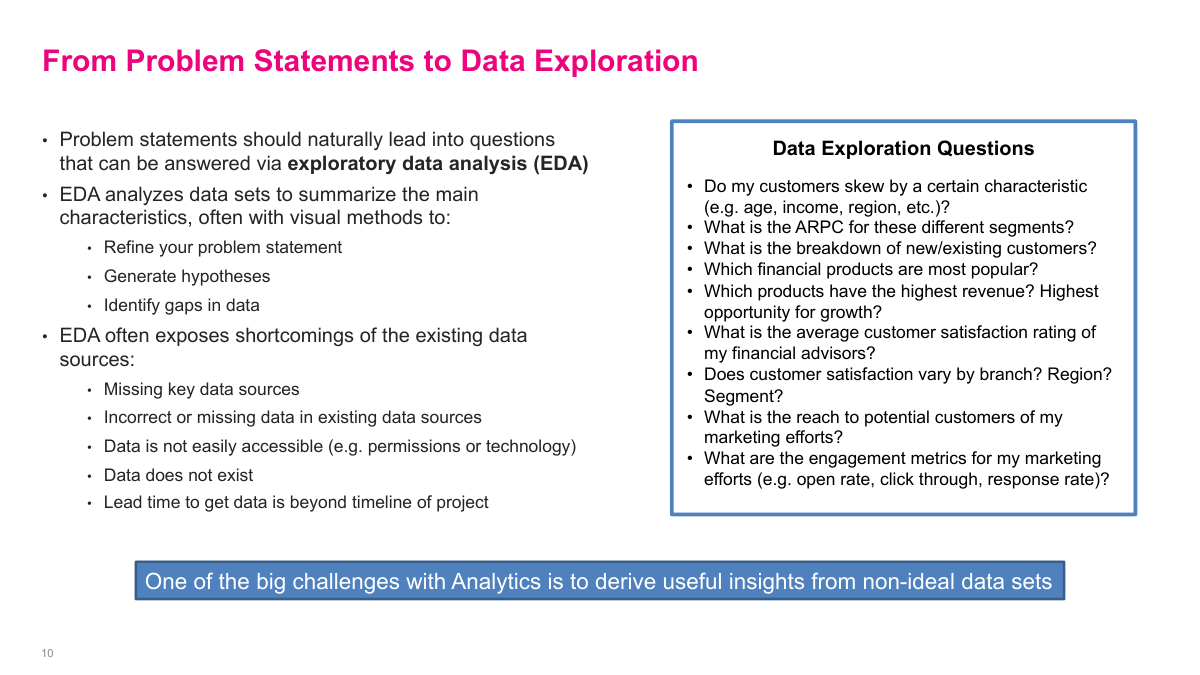
Problem statements should naturally lead into questions that can be answered via exploratory data analysis. EDA analyzes datasets to summarize their main characteristics, often with visual methods. It helps you refine your problem statement, generate hypotheses, and identify gaps in the data. EDA also frequently exposes shortcomings in your data sources — missing key data, incorrect or missing values in existing sources, data that isn't easily accessible due to permissions or technology constraints, data that simply doesn't exist, or lead times to get data that exceed your project timeline. On the right side you can see typical data exploration questions for our banking example: do customers skew by certain characteristics? What's the ARPC for different segments? What's the breakdown of new versus existing customers? Which products are most popular and have the highest revenue? What's the average customer satisfaction rating? One of the big challenges with analytics is deriving useful insights from non-ideal datasets — and that's a reality you'll face on nearly every project.
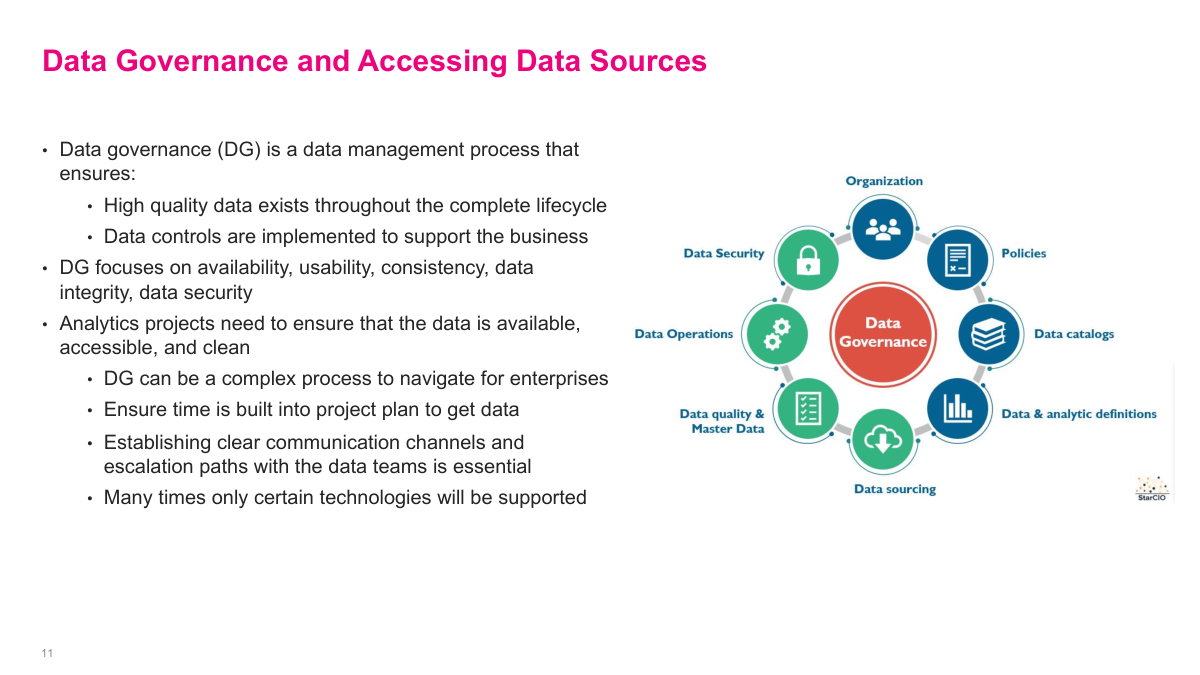
Data governance is a data management process that ensures high-quality data exists throughout the complete lifecycle and that data controls are implemented to support the business. It focuses on availability, usability, consistency, data integrity, and data security. For analytics projects, you need to ensure your data is available, accessible, and clean. Data governance can be a complex process to navigate for enterprises — you need to build time into your project plan to get the data you need. Establishing clear communication channels and escalation paths with the data teams is essential. Many times only certain technologies will be supported, which constrains your tooling choices. The diagram shows the key components: organization, policies, data catalogs, analytic definitions, data sourcing, data quality and master data, data operations, and data security — all orbiting around the central data governance function.
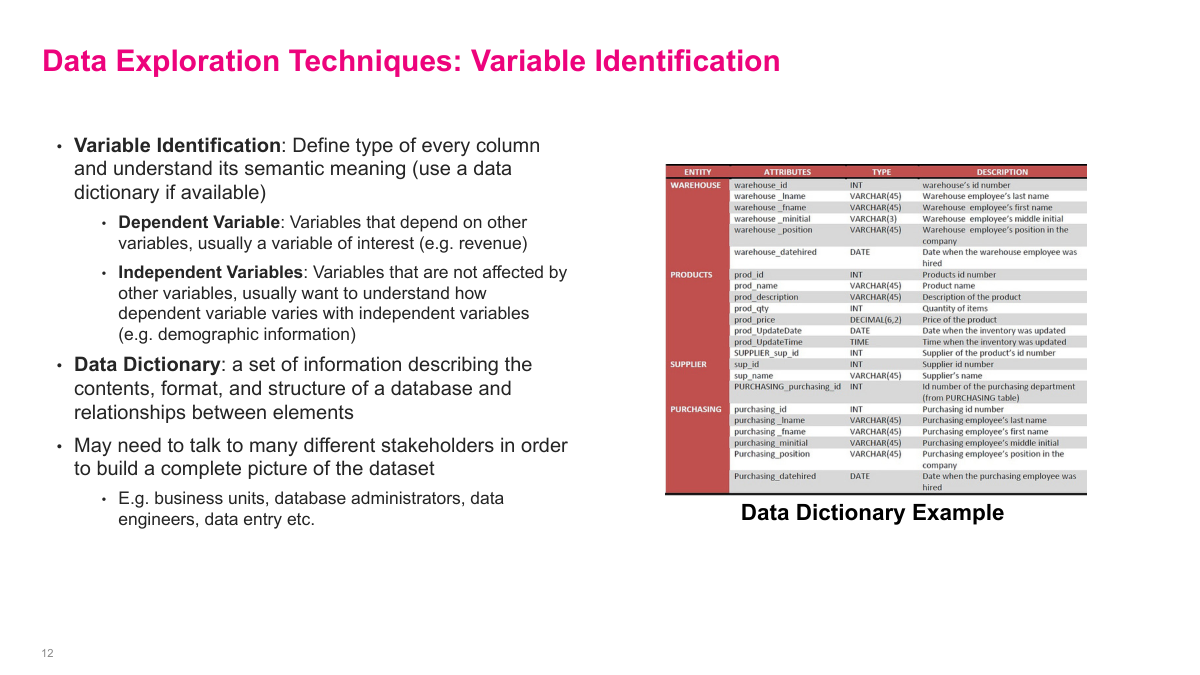
Variable identification is the first pass that makes the rest of exploration possible. I want to know what every column actually means, what type it is, whether it behaves like an input or an outcome, and how different tables relate to each other. A data dictionary is the obvious starting point, but in practice it is rarely enough on its own. You usually have to talk to business owners, data engineers, DBAs, or even the people entering the data to understand the semantics properly. If I misclassify a variable or misunderstand what it represents, the rest of the analysis is built on sand.
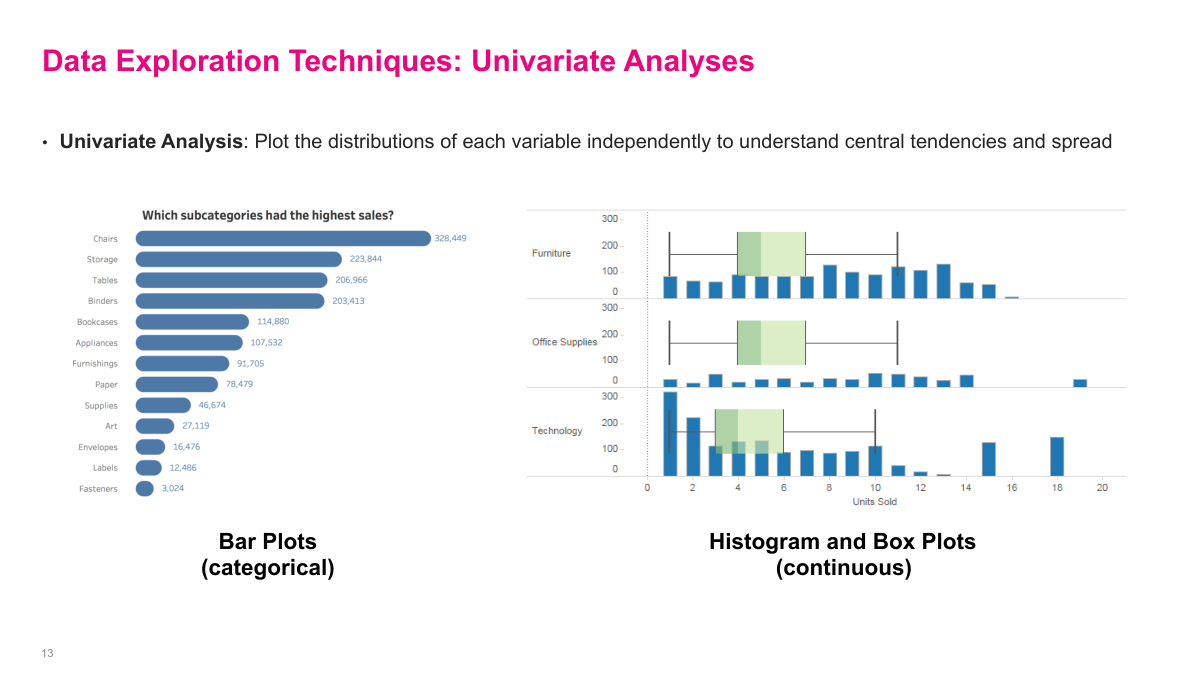
Univariate analysis is just looking at one variable at a time, but it is still a useful diagnostic tool. Histograms, box plots, and bar charts help me understand central tendency, spread, skew, and whether there are strange outliers or category imbalances. By itself this usually does not produce the final business insight, but it often explains why a KPI looks the way it does or points me toward a segment that deserves deeper investigation. It is basic work, but it saves a lot of wasted effort later.
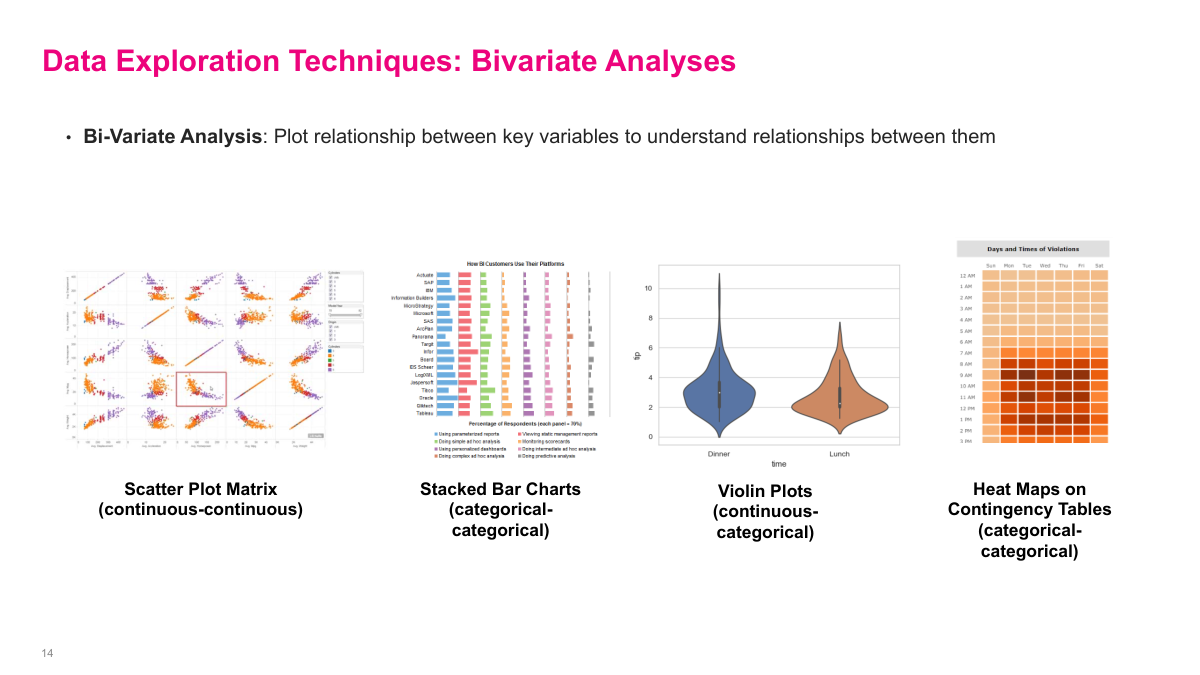
Bivariate analysis is where I start looking for relationships rather than just distributions. Scatter plots, stacked bars, violin plots, and contingency heat maps all help answer different versions of the same question: how do these variables move together? The search space gets big very quickly, so I do not blindly try every combination. I use business intuition to focus on the variables that plausibly matter first, then follow the more promising paths as the data starts to show me something interesting.
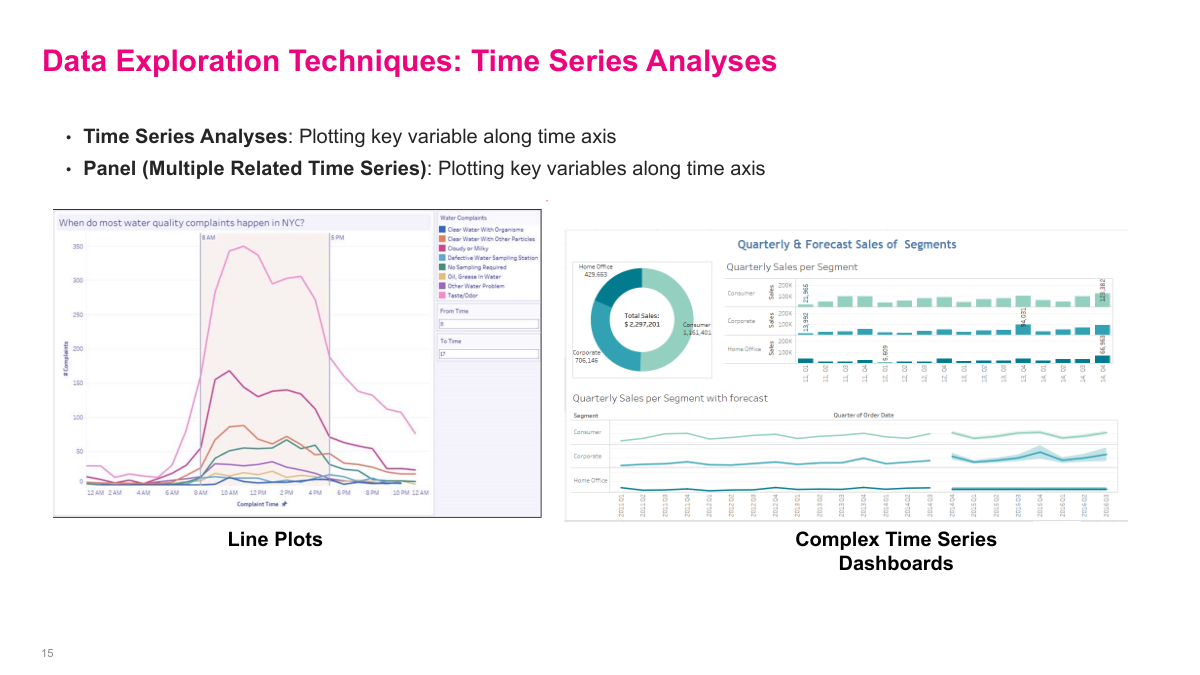
Time series analysis lets me see patterns that disappear in an aggregated table. When I plot a metric over time, I can spot spikes, seasonality, trend shifts, or operational events that would otherwise stay hidden. Panel views with several related series are especially useful because they show whether multiple metrics move together or whether one variable changes first and another reacts later. The point is to surface behavior that is not obvious from a top-line average.
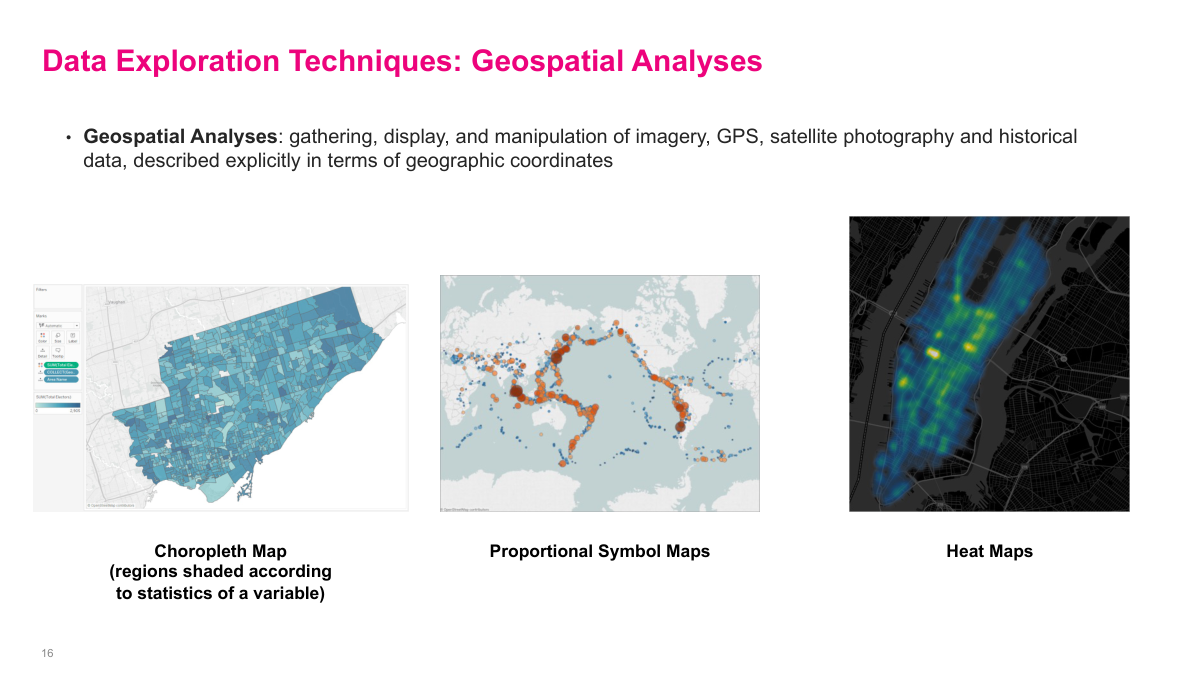
Geospatial analysis is another tool to keep in the toolkit when location actually matters. Maps, proportional symbols, and heat maps can reveal regional clusters, coverage gaps, or concentrations of activity that are hard to see in a spreadsheet. They are not automatically useful for every problem, but when geography is part of the mechanism, these visuals can become a fast way to generate and test ideas. Modern tools make them easy to produce, so the real challenge is knowing when they add signal instead of noise.
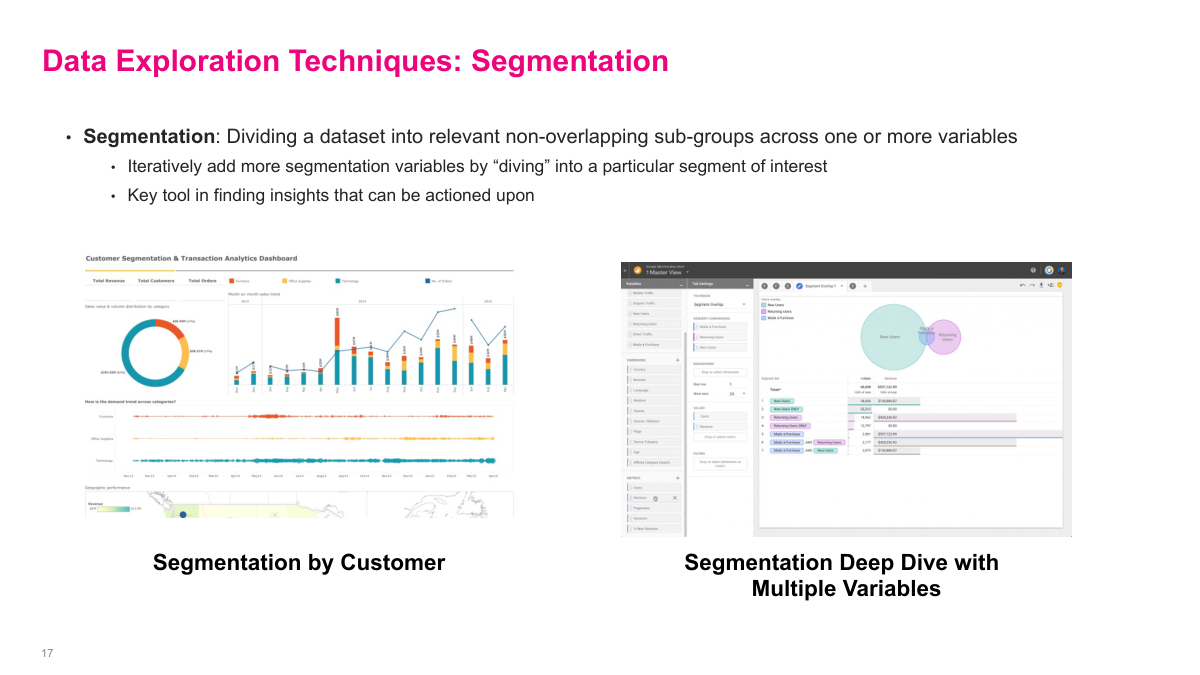
Segmentation is one of the most important techniques in exploratory analytics because aggregated numbers usually hide the interesting story. Once I break the data into meaningful, non-overlapping subgroups, I can start to see which business units, customer cohorts, products, or channels behave differently from the average. The process is iterative: I split on one variable, find something interesting, then keep drilling into that segment with another variable. That is how many actionable insights are found in practice — not at the top level, but several layers down where the business mechanics become visible.
Section 4: Analytics Iteration
This is the point where exploration turns into iteration. Up to now the goal has been to understand the data and frame the problem well. From here, I move into a loop of generating hypotheses, testing them with evidence, and refining the analysis based on what the data supports or rejects.
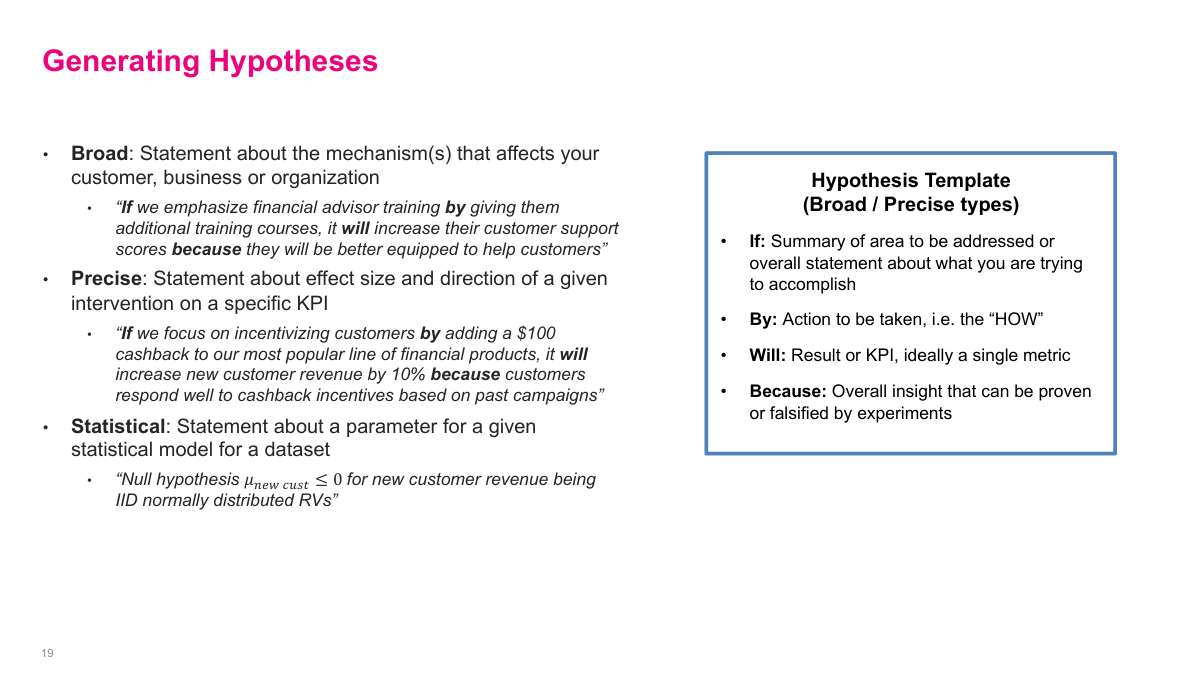
A hypothesis can be broad, precise, or fully statistical, but the common idea is the same: I am making a claim that can be challenged with evidence. In business settings, the broad and precise forms are usually more useful than formal null-hypothesis language. The if-by-will-because template is a good discipline because it forces me to name the action, the expected result, the single KPI I care about, and the logic that connects them. Even when teams are not writing hypotheses explicitly, they are usually operating with one implicitly.
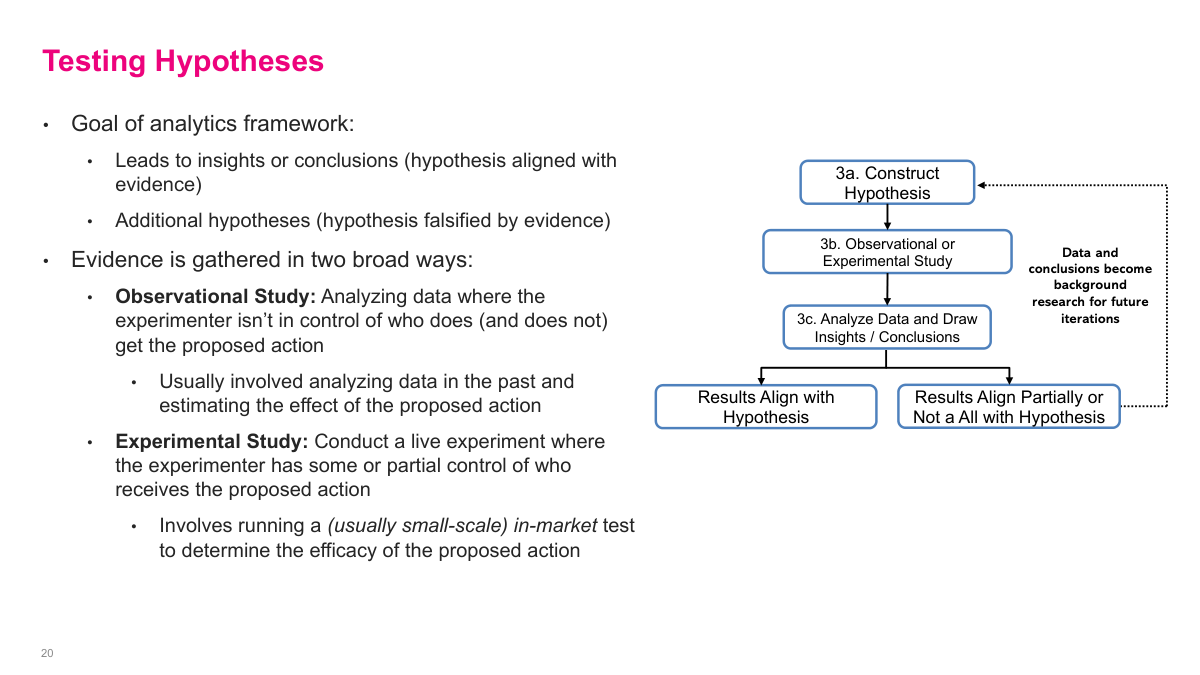
Testing a hypothesis is really the core loop of analytics iteration. I state the claim, choose an observational or experimental study, analyze the evidence, and then either build confidence in the hypothesis or falsify it. The important point is that both outcomes are useful. Supporting evidence can justify action, while contradictory evidence becomes background research for the next iteration and helps me formulate a better hypothesis instead of pretending the first one was right.
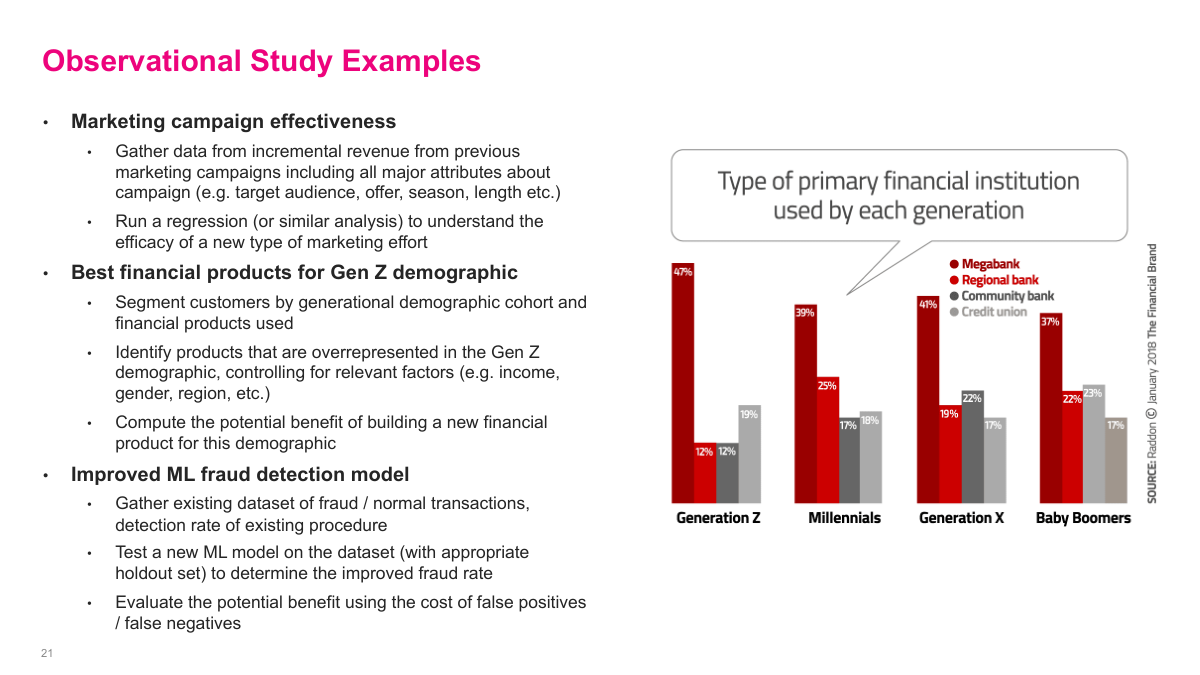
Observational studies use data that already exists, so they are often the cheapest way to get directional evidence. I can look at historical marketing campaigns and estimate the impact of discount rates, segment customers to see which products over-index for Gen Z, or evaluate a fraud model offline on labeled historical transactions. These studies do not give me the same confidence as a controlled experiment, but they are often good enough to narrow the search space and decide what is worth testing for real.
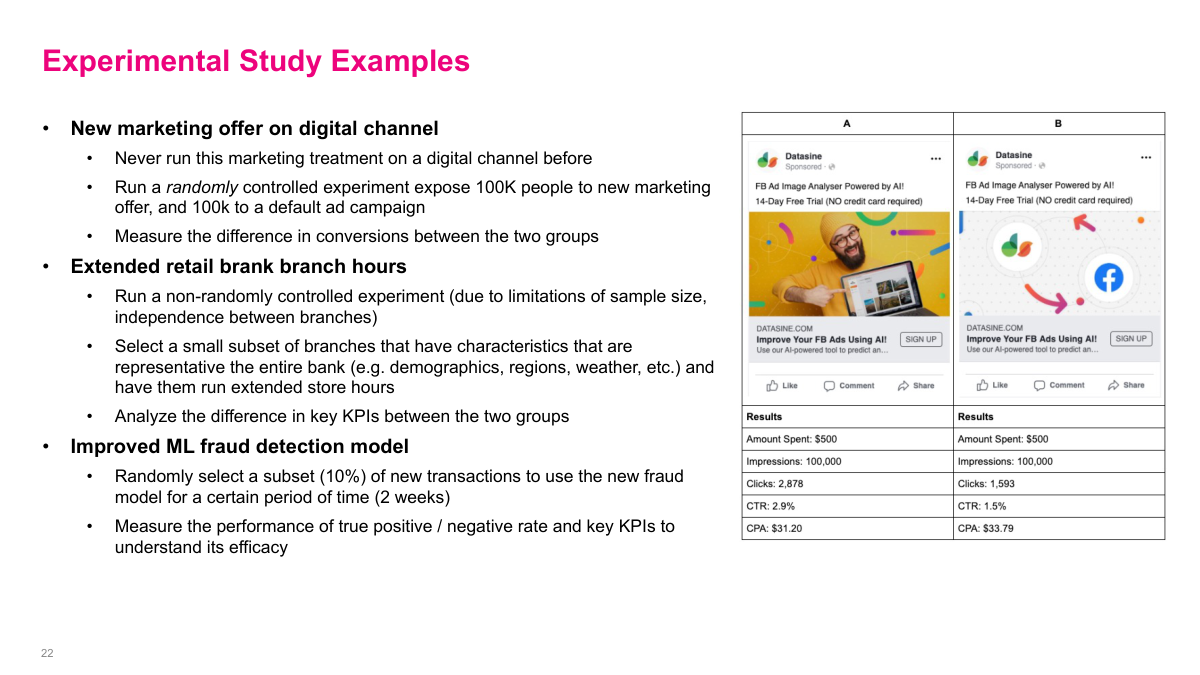
Experimental studies are the stronger but more expensive option because I am intervening in the real world. That could mean a randomized A/B test on a marketing offer, changing branch hours in a representative set of locations, or running a champion-challenger test for a fraud model on a slice of live traffic. Because these tests cost time, money, and sometimes customer risk, I usually want decent evidence from earlier analysis before proposing them. They are powerful, but they should be used deliberately.
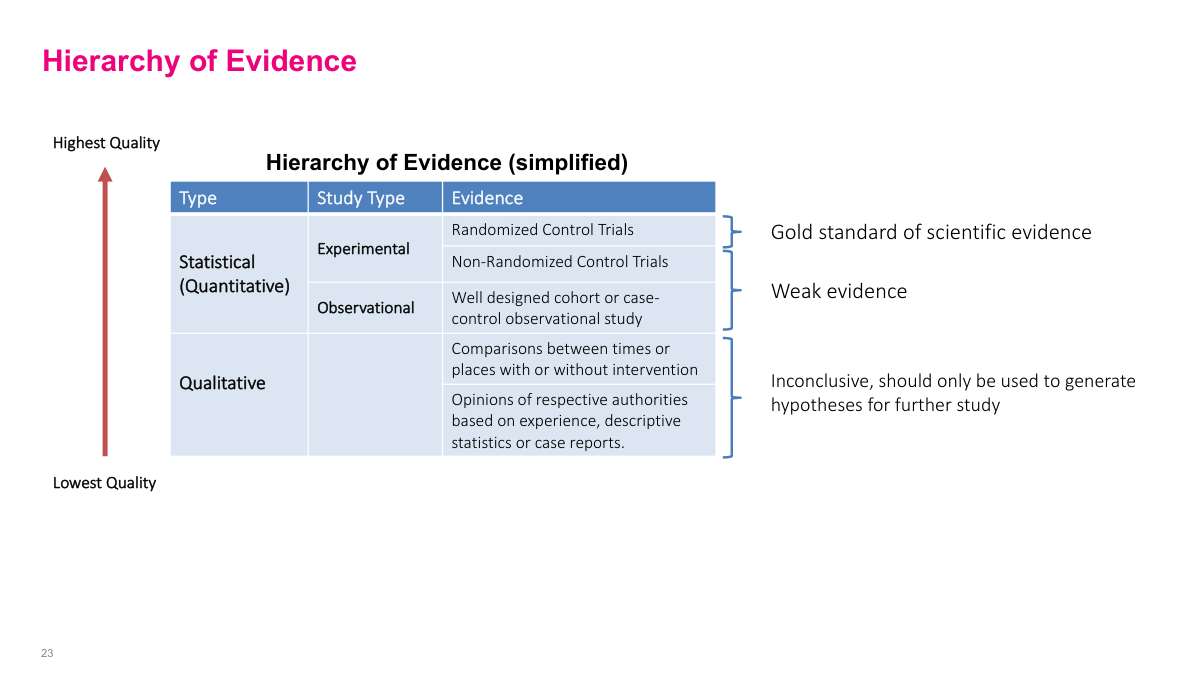
The hierarchy of evidence is a reminder that not all conclusions deserve the same level of confidence. Randomized controlled trials sit near the top because they do the best job isolating cause and effect, while observational studies are weaker and qualitative evidence is often only good enough to generate hypotheses. In practice, I usually move up this ladder over time: start with weak but cheap evidence, then spend more only when the case becomes strong enough to justify it.
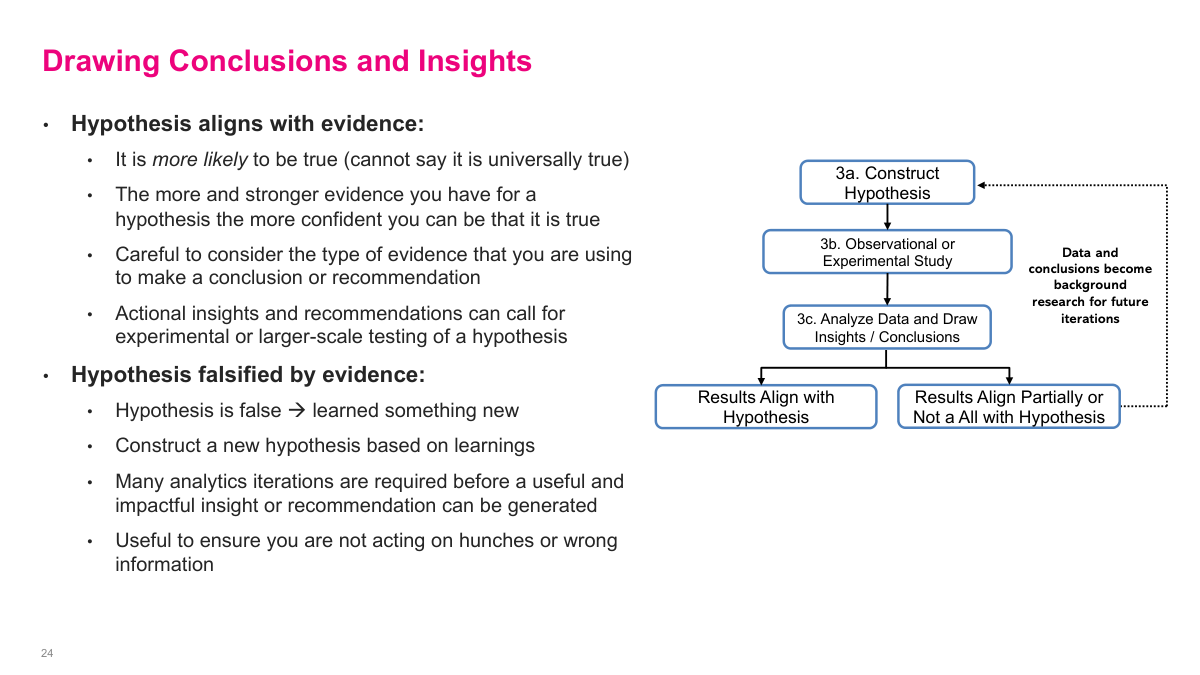
When the evidence aligns with the hypothesis, I still do not get to claim universal truth. What I really have is a stronger reason to believe the statement and, depending on the evidence quality, enough confidence to recommend action or a larger test. When the evidence goes the other way, that is not failure. Falsifying a hypothesis means I learned something real about the business, and those learnings should feed directly into the next iteration instead of being discarded.
Section 5: Story Telling with Data
The last section shifts from doing the analysis to communicating it well. Good analytics work can still fail if the narrative is weak, the audience is ignored, or the visuals are misleading. The goal here is to turn evidence into a presentation that helps people make better decisions.
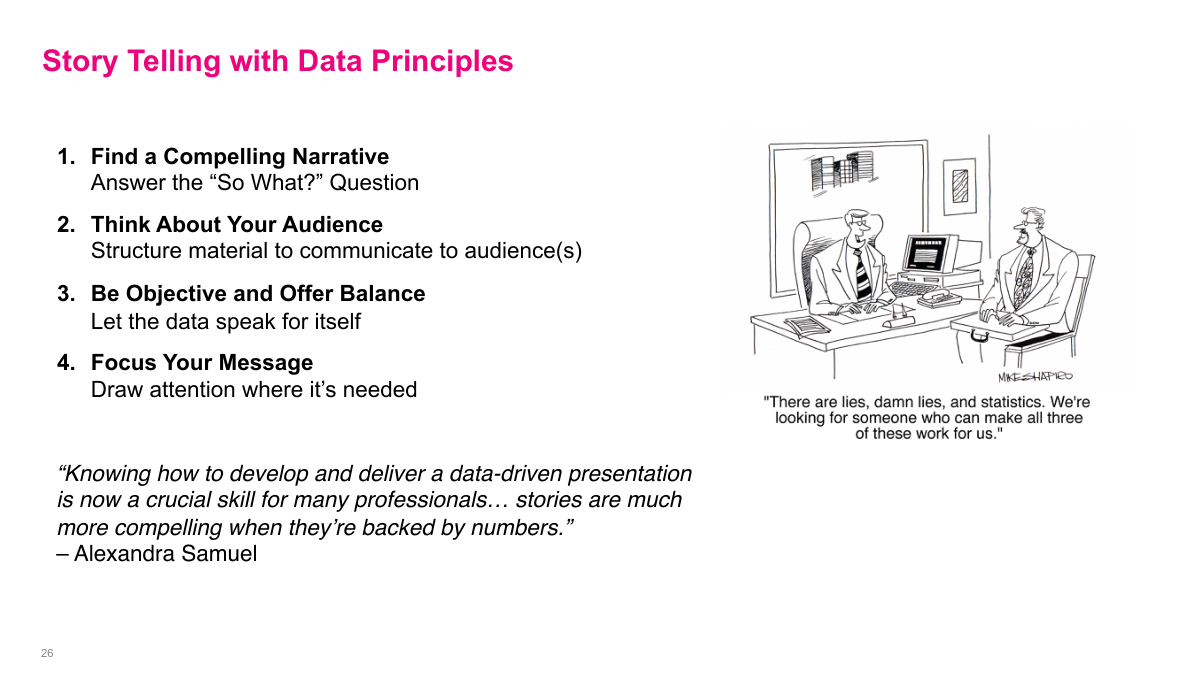
There are four principles I keep in mind when presenting data-driven work. I need a compelling narrative that answers the so what question, I need to structure the material for the audience in the room, I need to stay objective and balanced instead of forcing the story, and I need to focus attention on the parts that matter. This is where analytics becomes partly an art: not fabricating a story, but shaping the evidence so the right message is clear.
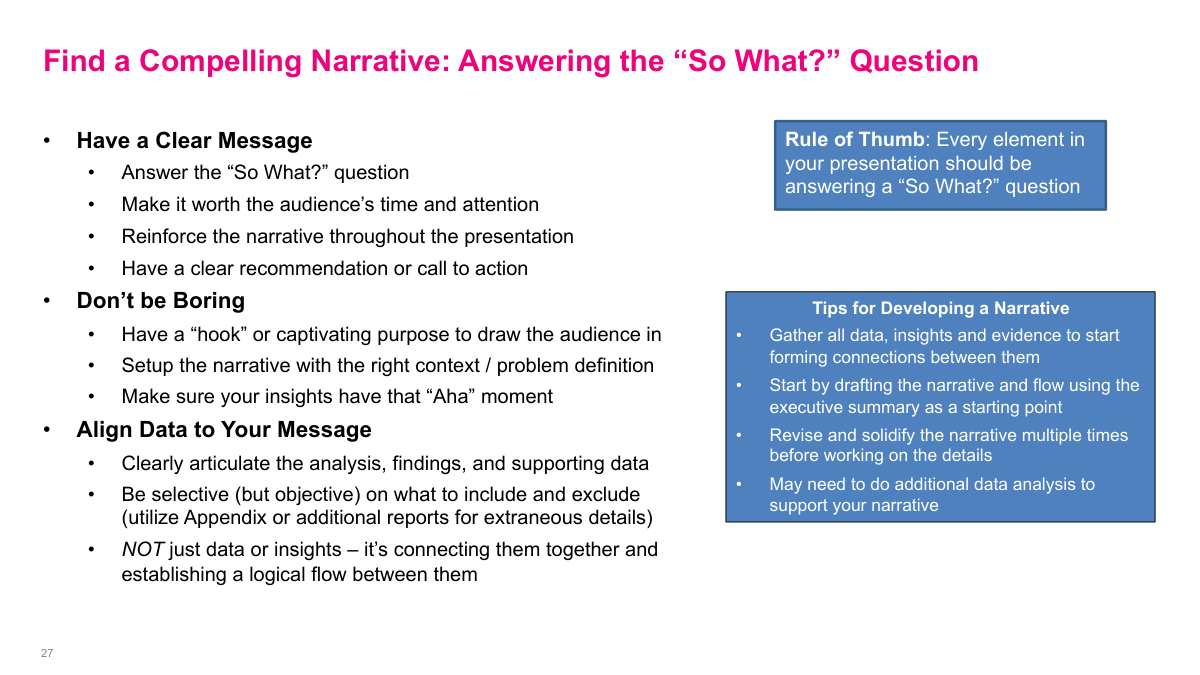
A compelling narrative starts with a clear message that makes the audience care. If I cannot answer the so what question, the presentation is probably not worth their time. I also want a hook, some context, and ideally an aha moment that makes the insight memorable. One practical way to build this is to sketch the executive summary first, revise the narrative several times, and then add only the analyses that genuinely support that message.
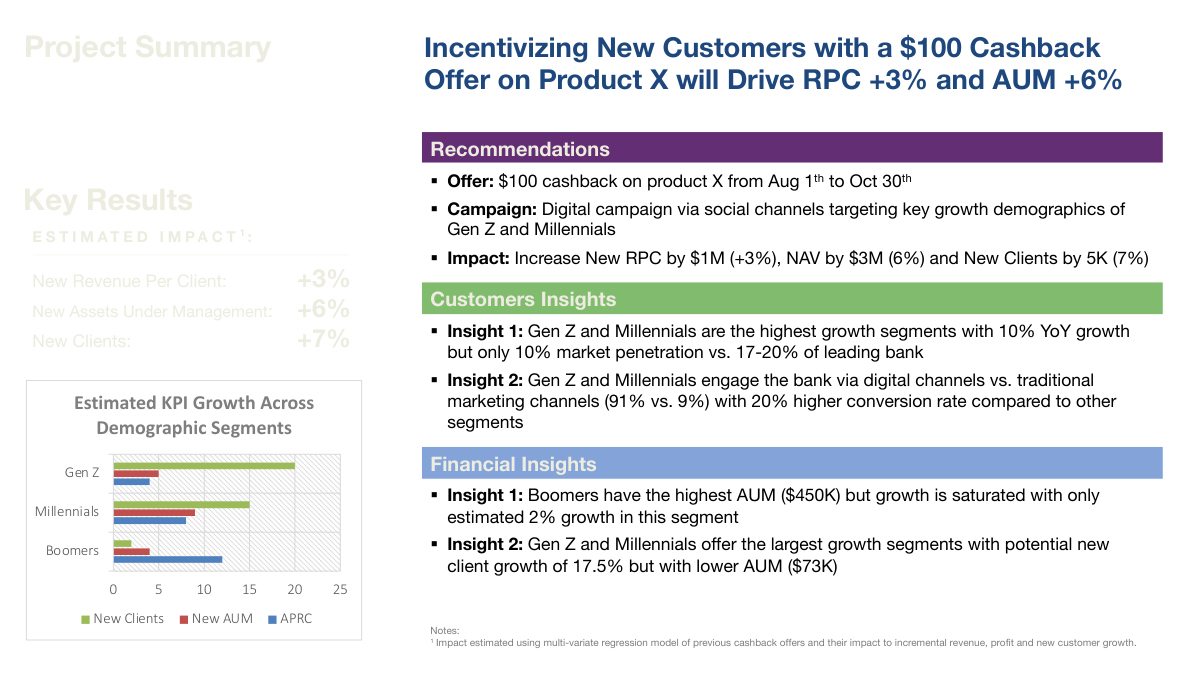
This slide is a decent example of an executive-summary style page because the title already states the main recommendation and expected business impact. The rest of the slide then earns that headline: it gives the key results, the supporting customer and financial insights, the recommendation, and enough evidence to show where the numbers came from. It is not perfect, but it illustrates the right pattern. The audience should be able to understand the core takeaway quickly, then inspect the supporting details only if they need to.
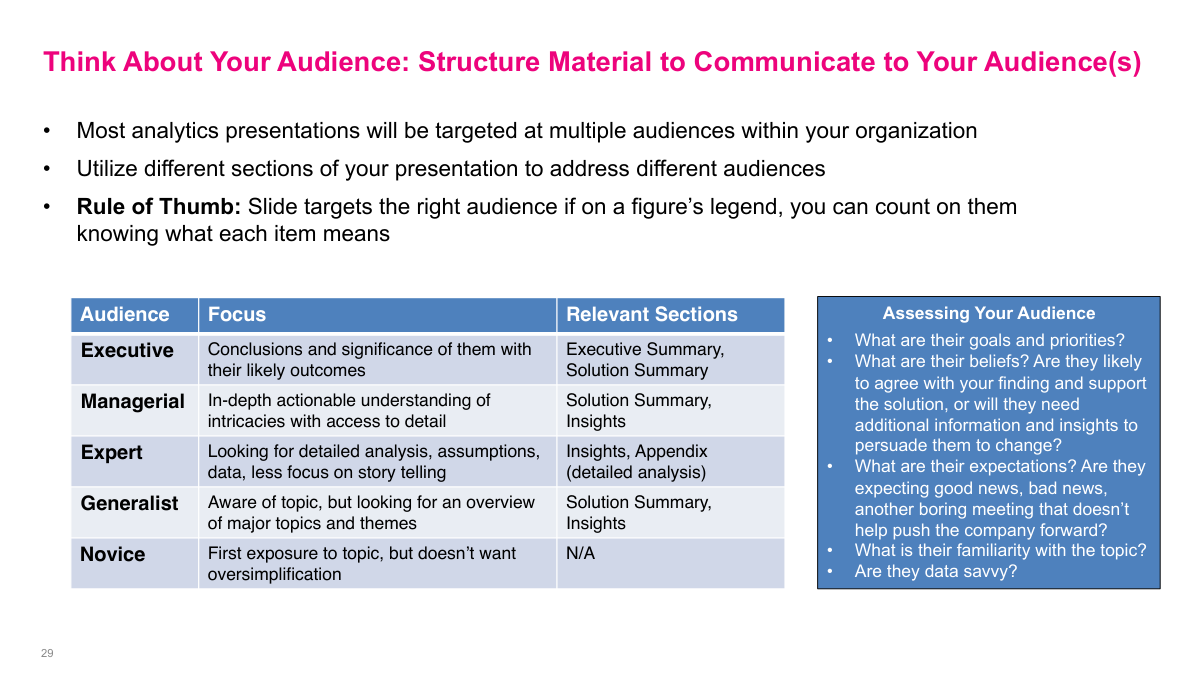
Different audiences care about different levels of detail, so I should not present the same way to everyone. Executives want the decision, the significance, and the recommendation. Managers usually need more depth on execution, experts want the technical details, and less experienced audiences may need more context just to follow the conversation. If I know who is in the room, I can structure the deck so each section serves the people who care most about it instead of overwhelming everyone with the same level of detail.
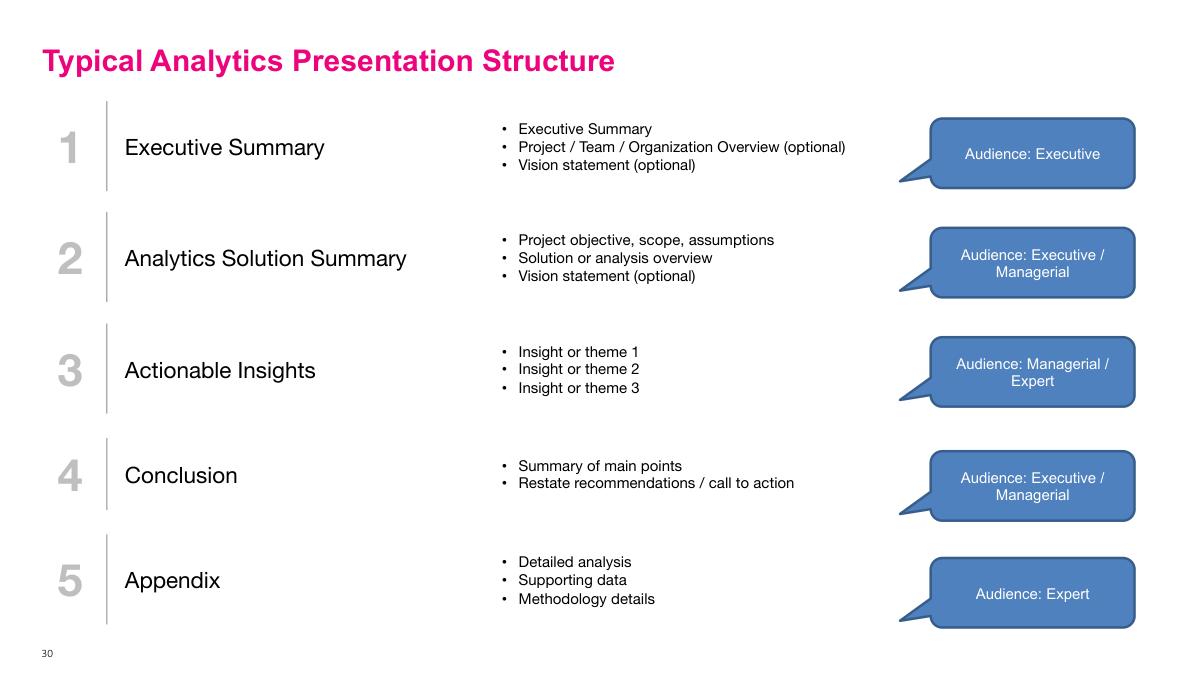
A typical analytics deck moves from the executive summary into the solution summary, actionable insights, conclusions, and then the appendix. That ordering matters because senior audiences usually want the headline first and may never sit through the entire deck. In practice, a 50-page presentation often turns into a discussion after only a few slides. That is why the front of the deck has to stand on its own, while the appendix carries the supporting analysis for the people who want to dig deeper.
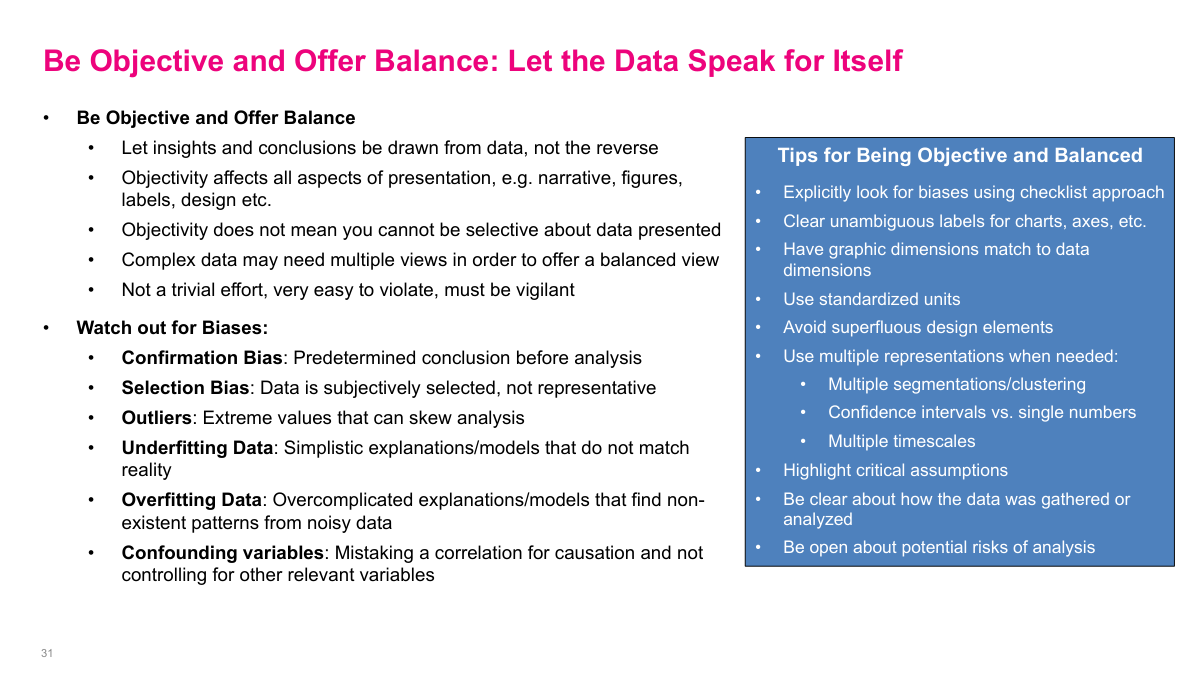
Being objective does not mean dumping every chart I produced into the deck. It means being selective while still letting the data, assumptions, and limitations speak honestly. Bias can creep in through chart choices, framing, omitted context, or even the way I summarize results, so it helps to use a checklist and actively look for confirmation bias, selection bias, overfitting, underfitting, and confounding. The work is not just to persuade people, but to persuade them fairly.
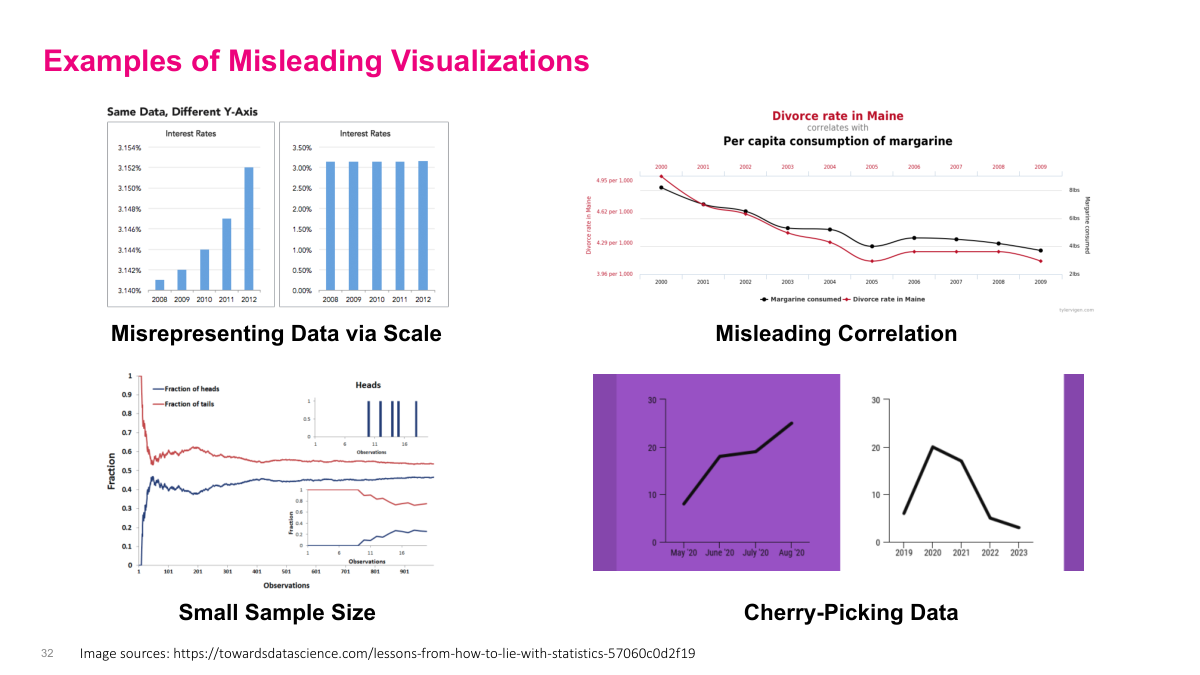
Misleading visuals are often created with simple tricks rather than complicated fraud. I can exaggerate tiny changes by shrinking the axis range, tell a false story with a very small sample, imply causation through a spurious correlation, or cherry-pick a convenient time window that hides the broader trend. None of those change the underlying numbers, but all of them distort the audience's interpretation. That is why visual design is not neutral — it can either clarify the truth or bend it.
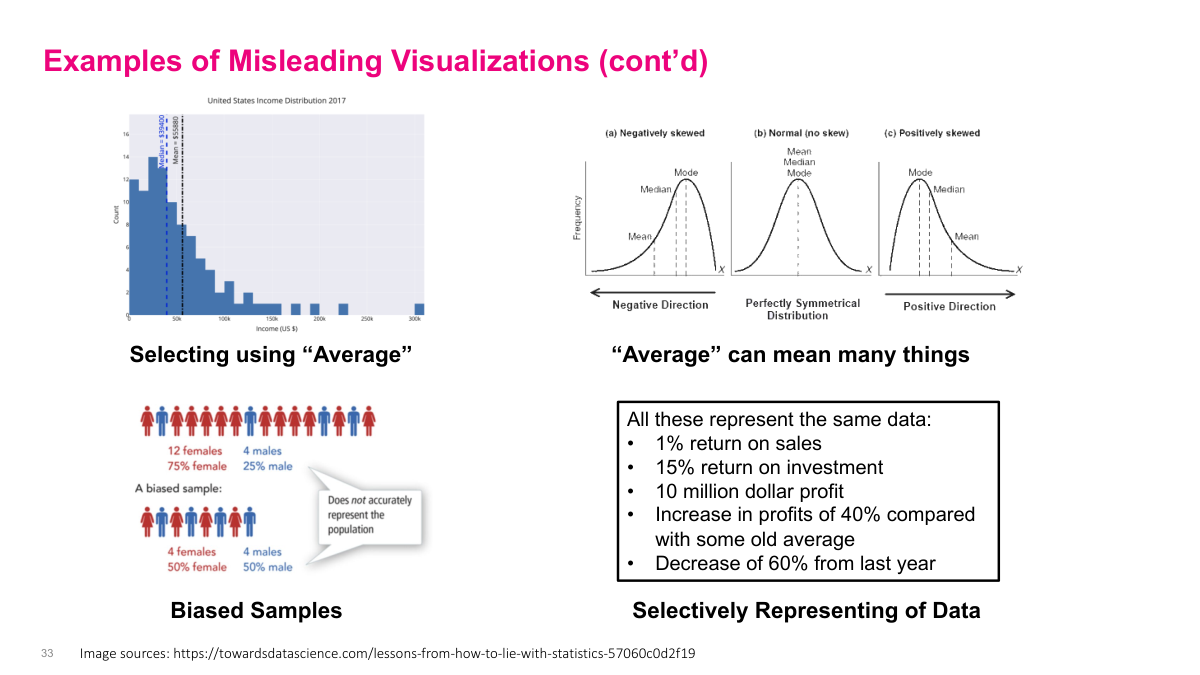
Even the word average can be misleading if I do not explain what I mean. In skewed data, the mean, median, and mode tell different stories, and the wrong choice can overstate or understate the result. Sampling can be misleading too: a sample that looks balanced may still be unrepresentative if the underlying population is not balanced. More generally, complex situations can be framed in several technically true ways, so the job is not to list every possible interpretation, but to choose a balanced set that fairly represents reality.
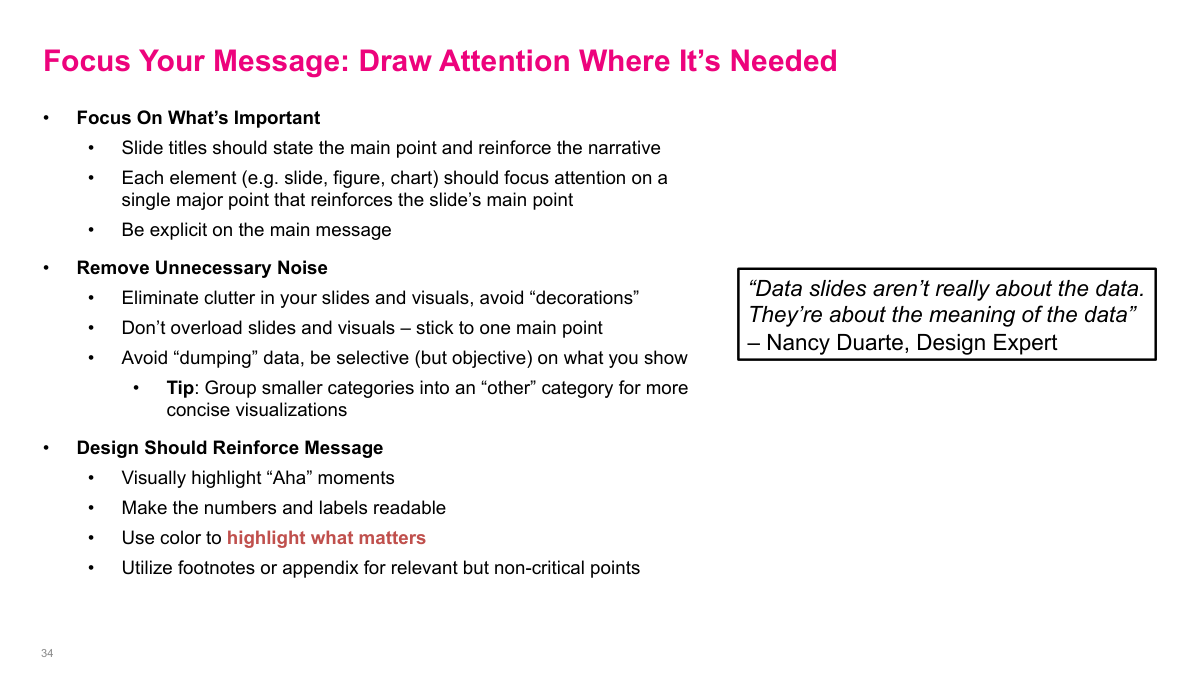
Focusing the message means every element on the slide should reinforce one main point. The title should state the takeaway, the chart should support that takeaway, and unnecessary clutter should be removed so the audience knows exactly where to look. If I need a dense analysis to back up the point, I can move it to a footnote or appendix instead of cramming everything into the main slide. Good slides do not merely show data; they direct attention toward meaning.
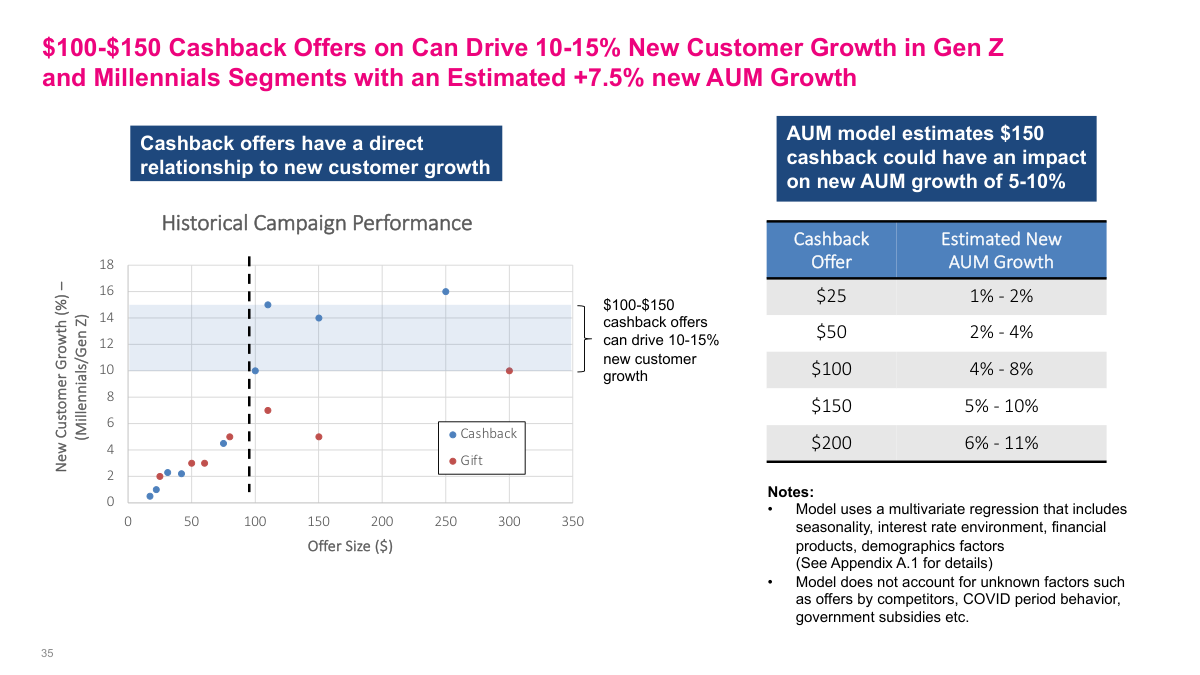
This example works because the title states the insight directly instead of hiding behind a generic label like executive summary. The left chart gives evidence for the claim that mid-sized cashback offers drive stronger new-customer growth in the target segments, while the table on the right connects those offers to estimated AUM impact. Just as important, the footnotes and callouts make the assumptions and limitations explicit: the AUM numbers come from a model, the model inputs are named, and several external factors are called out as exclusions. That combination of clear headline, supporting evidence, and transparent caveats is exactly what a strong analytics slide should look like.
Analytics is one of those terms everyone throws around but few people define precisely. Data is what we collect. Analytics is the discovery, interpretation, and communication of patterns in that data. But what we really want are actionable insights — understanding a phenomenon well enough to change a decision or seize an opportunity. Without that, we're just making charts for no reason. You'll hear about descriptive, diagnostic, predictive, and prescriptive analytics. Descriptive is summaries and charts at the top; prescriptive might be modern AI agents at the bottom; machine learning sits in the predictive layer. Ideally you build a toolkit across all of these. One piece of career advice: really try to understand what's going on in the business. If you don't understand the business context, you have very little hope of affecting change with technology alone. The technical skills matter, but they're only powerful when paired with genuine business understanding.